
–This post has been updated to reflect 2023 numbers, but you can find the old 2019 post article where I talk about why revenue multiples and EBITDA multiples are used for valuing software companies.–
I have been tracking valuation multiples for tech software companies since 2019.
It is fascinating to see how the valuation multiples change year over year, reflecting what’s going on around the world.
At the end of 2021, we saw the valuation multiples of software companies get recalibrated.
Then, in the Spring of 2022, the Ukraine war broke out and the rest of 2022 saw a reckoning of software company valuations.
Tech companies continued to see suppression in the beginning of 2023, but we are seeing a bit of an inflection point now in 2023.
Let’s take a look at what happened in 2022 and where we are now in 2023.
What are the valuation multiples of software companies as of 2023?
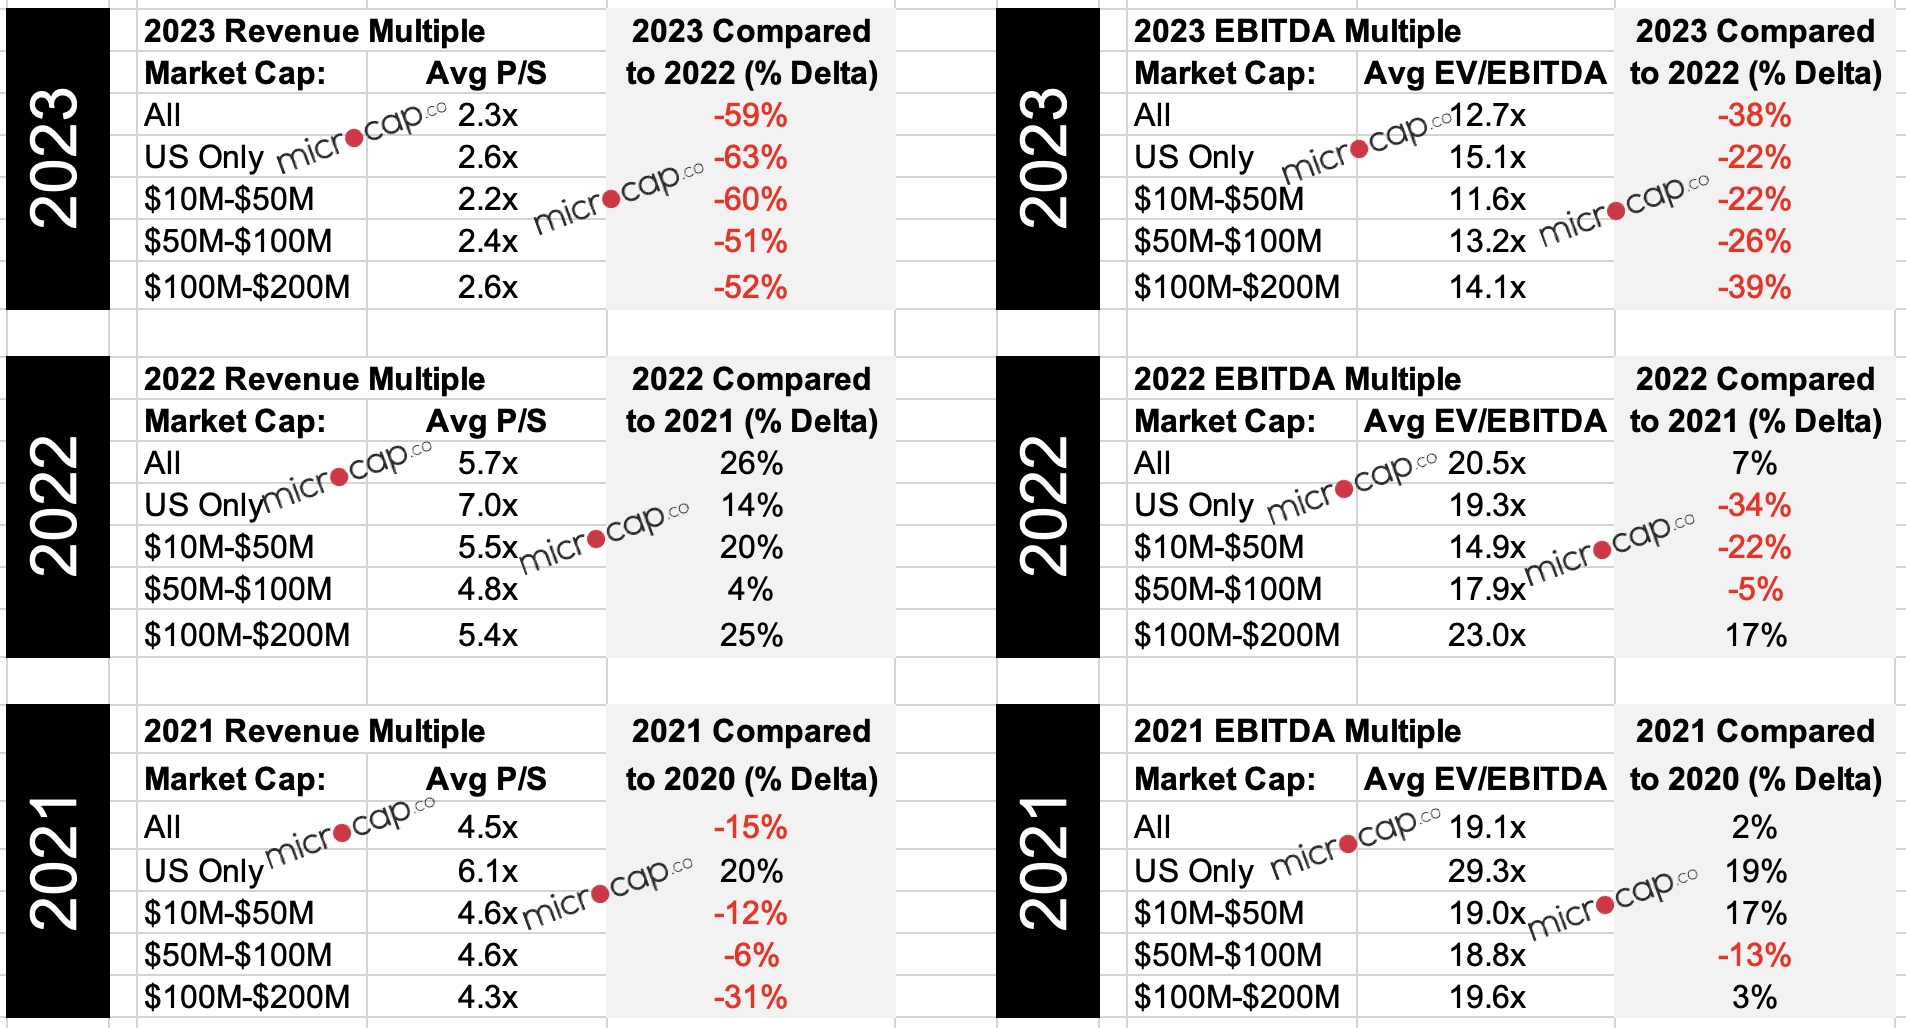
The valuation multiples of all publicly traded software companies that have available data is as follows.
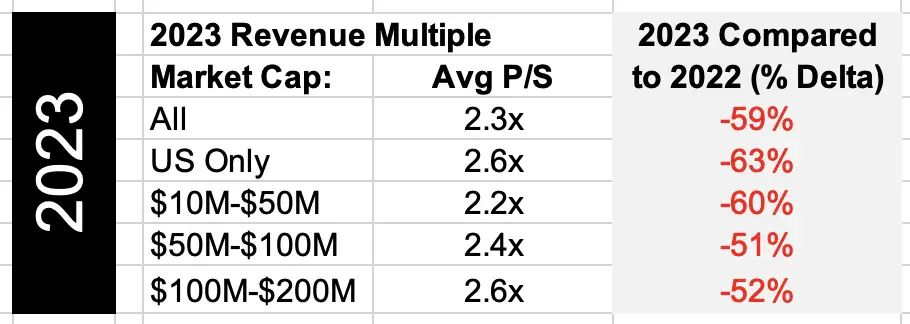
In 2023, the average revenue multiple is 2.3x.
The average revenue multiple of American tech companies is 2.6x, which is slightly higher than the global average.
The average revenue multiple for small tech companies increase slightly as their market cap increases, from 2.2x to 2.6x.
But overall, the average revenue multiple of 2.3x to 2.6x is 50% to 60% lower than the revenue multiples of tech companies in 2022.
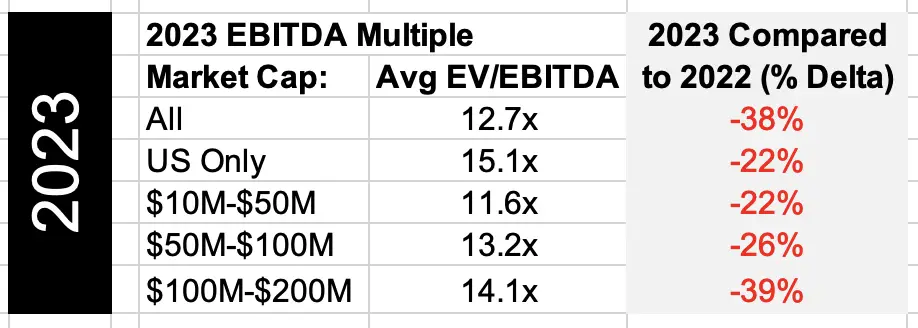
In 2023, the average EBITDA multiples for software companies also plummeted compared to 2022, but not as much as revenue multiples.
The average EV / EBITDA multiple of all software companies is 12.7x.
The US software companies have a higher EV / EBITDA multiple of 15.1x.
We’ve observed this in the past 2 years, so it is interesting to see that this trend holds in 2023 as well.
Similar to revenue multiples, the EV to EBITDA multiples for smaller software companies is lower at 11.6x and rises to 14.1x for larger companies.
Overall, 2023 EBITDA multiples are 20% to 40% lower than 2023 EBITDA multiples for software companies.
How Much Did Valuation Multiples for Software Companies Go Up By Post Covid in 2020?
Since 2020, the valuation multiples for software companies went up significantly after the spike in the market post-covid in 2021.
However, it was mainly big tech companies that became over-valued. Microcap companies actually saw a decline.
Then, we saw a huge pull-back for big tech companies at the end of 2022. But interestingly again, microcap tech companies weren’t affected by the pull-back.
Scroll down to see how 2022 numbers compare to 2021 and previous years.
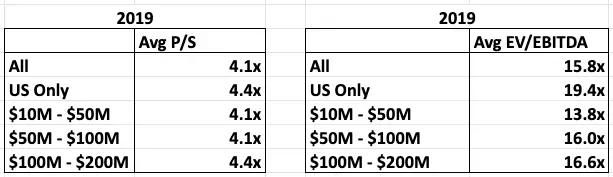
Here is a snapshot of how the microcap software companies were doing in March 2019.
Back in March 2020, we saw a huge dip in the market after the Coronavirus hit the US and it became a reality that we would be experiencing the same quarantine as we saw in Asia and Europe.
Then since the end of March, investors started dumping all their money into the stock market, resulting in a huge spike since then.
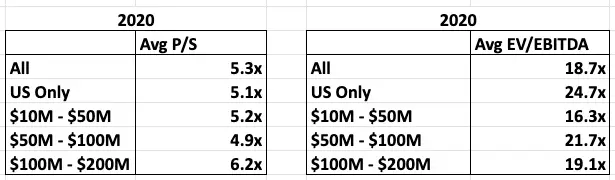
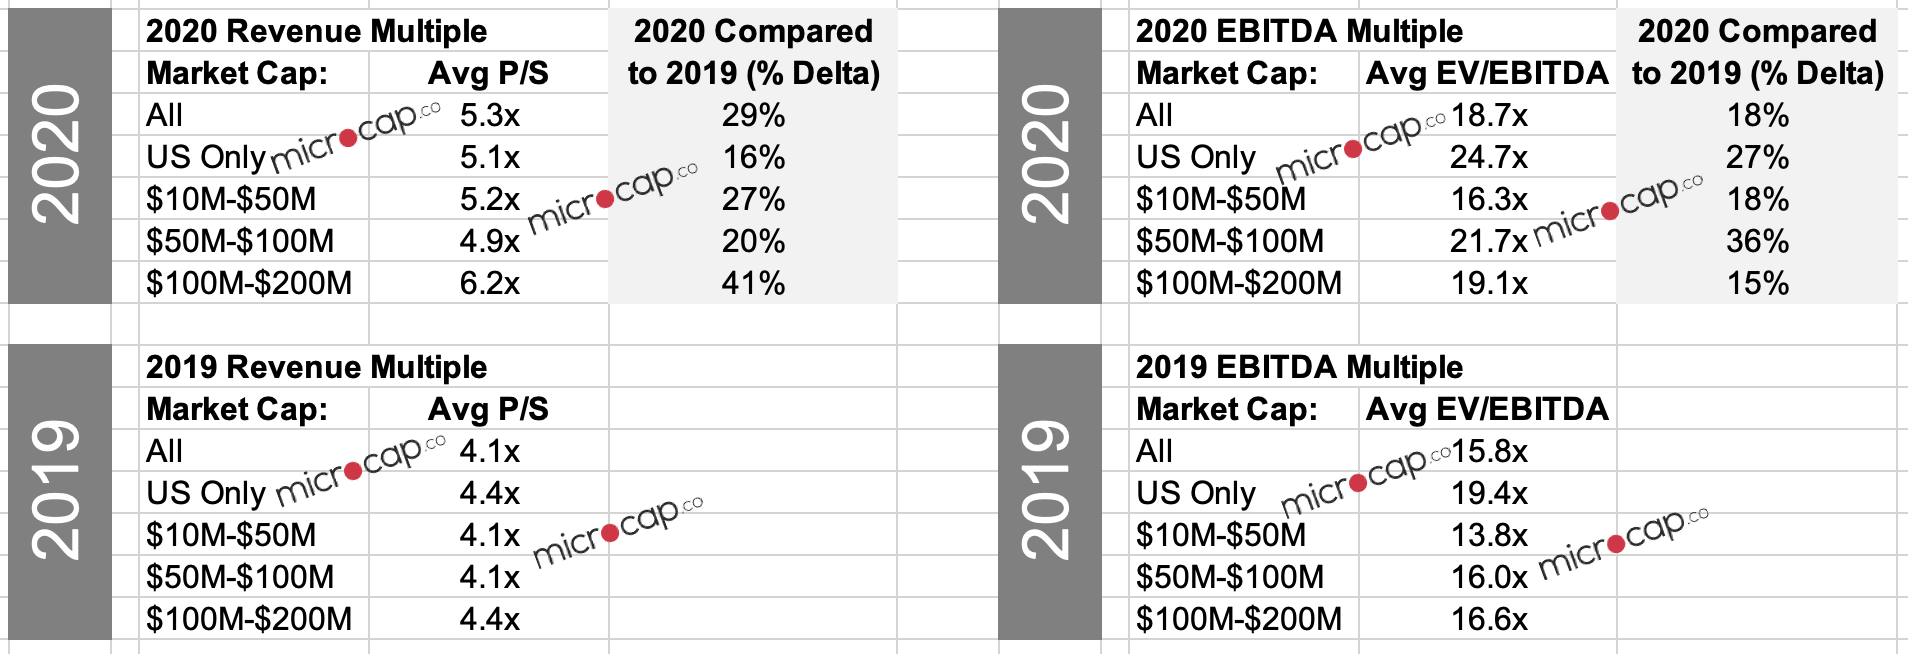
As a result, as of September 2020, microcap software companies have much higher valuation multiples:
I think investors from, novice to pro, are all dumbfounded. But one speculation is that it’s because government bonds aren’t worth returns, and so investors have nowhere to put it. Another reason for the spike is that during quarantine, retail investors have been investing like crazy.
If you compare the increase in each valuation multiple, that’s a 30% increase for average Price-to-Sales multiple for microcap software companies and 18% increase for average EV/EBITDA multiple:
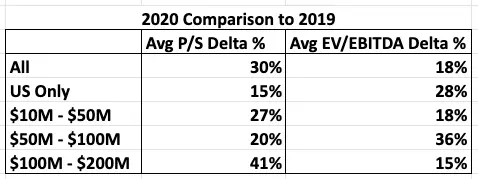
30% increase in P/S multiple has a huge impact on company transactions. If a small software company is on the market, they can increase their selling price significantly.
The small software company will use a combination of DCF valuation methodology and comparables. If there’s equal weighting between the valuation methodologies, the company can command a price at least 10% higher.
For example, if a 3 year old startup that has a negative EBITDA and revenues of $10M per year, they would weight P/S multiple higher as the valuation methodology.
If it were last year pre-Covid, they could’ve asked for $40M in selling price (i.e. $10M * 4.1x P/S multiple). Now, they could ask for $50M in selling price (i.e. $10M * 5x).
Of course, it’s a simple example and more qualitative and quantitative considerations go into it, but regardless, that’s a huge increase in selling price.
How Do the Tech Valuation Multiples Compare in 2021 to 2020?
Look at this snapshot of microcap tech companies’ revenue and EBITDA multiples in 2021:
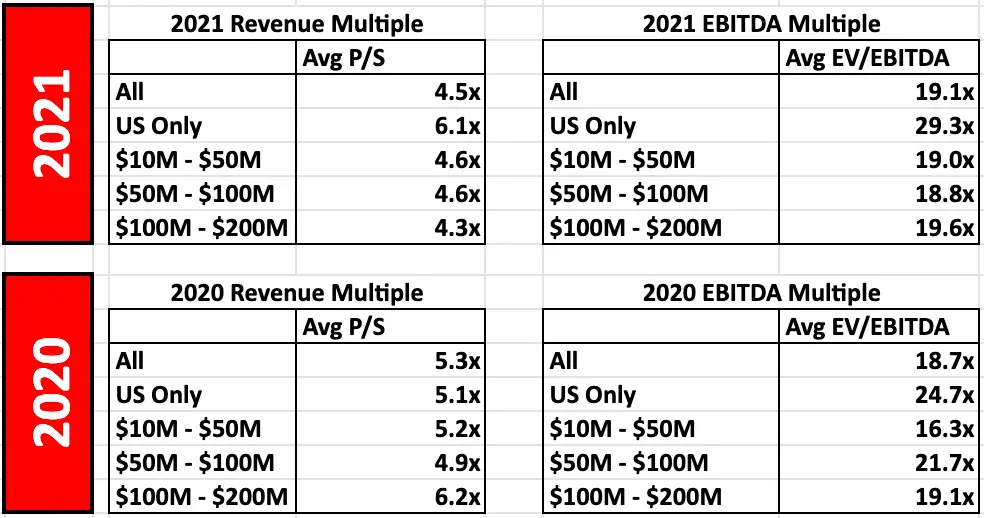
Really interesting things happened since we saw a huge rally in the tech valuation multiples from 2020 to 2021 and then a dip in beginning months of 2021. Here are some observations:
- Revenue multiples in 2021 overall are lower – For all microcap software companies globally, the average revenue multiple in 2021 is 4.5x compared to 5.3x in 2020. We observed a downtown in the market in the beginning of 2021, so that could be one reason for this trend.
- EBITDA multiples in 2021 overall are slightly higher – For all microcap software companies globally, the average EBITDA multiple in 2021 is 19.1x compared to 18.7x in 2020. It’s interesting that this is going the opposite way to the revenue multiple. One explanation could be that operating costs haven’t changed much in 6 months to a year but with lower revenues, the impact of lower revenue but same levels of operating costs may have had higher negative impact on EBITDA. And since the denominator (EBITDA) is lower, the EBITDA multiple could be higher.
- US Revenue and EBITDA in 2021 are higher – For American tech companies, revenue and EBITDA multiples both are higher in 2021 with average revenue multiple of 6.1x in 2021 compared to 5.1x in 2020, and average EBITDA multiple of 29.3x compared to 24.7x. This could be just a coincidence, but one explanation could be that post-Covid lockdowns, with people shifting their behavior to spend more time at home going forward, US tech companies have collectively done a good job of adapting to the changing environment, and the market is confident in these companies more so than before. (Again, this is just my own explanation, so don’t take this as investment advice.)
How Do the Valuation Multiples Compare to Industry
The increase in the valuation multiples from March 2019 to September 2020 makes sense when you compare it to the industry performance.
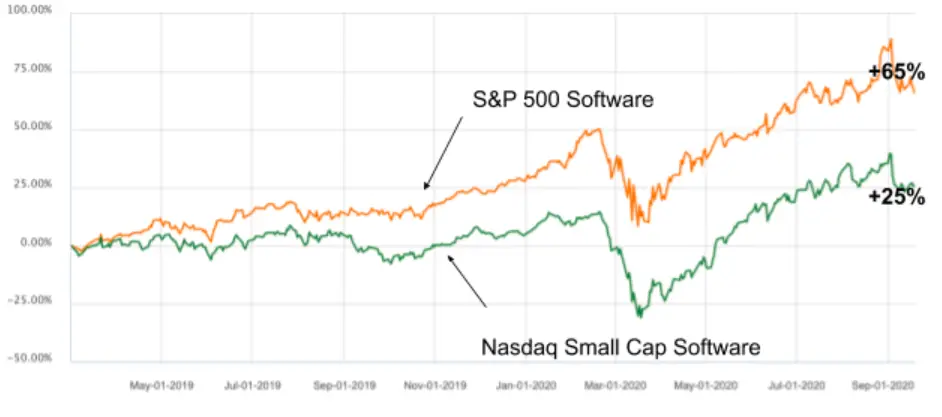
The graph above shows software indices from March 1, 2019 to September 18, 2020.
The orange line (higher) is the S&P 500 Software industry index. The increase over the 1.5 years is +65%.
The green line (lower) is the Nasdaq US Small Cap Software companies index. The performance in the 1.5 years is +25%.
The large software companies (i.e. S&P 500 software) did almost three times better than the small software companies. This makes sense, because the large tech companies thrived during the pandemic as they catered to people in quarantine. Companies like Amazon, Apple, Fastly, Zoom, Etsy, etc.
Since the smaller companies aren’t as well known as the mega tech companies, they performed fantastically as well but not as much as the large tech software companies.
We’ll have to see if the market normalizes after the pandemic is over. Once this happens, I’ll update the valuation multiples for software companies again.
Comparison Summary from 2019 to 2022
Interestingly, microcap companies were not affected by the over-valuation of the market post-covid that applied to big software companies in 2021.
At the end of 2021, with the announcement from the Fed of interest rate hikes in 2022, the market started pulling back, and the software companies that were once overvalued at the height of the market increase in 2021 fell back.
But overall, it seemed to have an opposite effect for microcap companies.
The summary of the comparison revenue and EBITDA multiples are below:
How To Use Valuation Multiples To Value a Company
For those who are not familiar with using valuation multiples to value companies or those who are but need a refresher, I wrote posts detailing exactly how you can do that.
Hopefully you can use them as helpful guides. Click on the link below to go to the post.
- How to value a company based on revenue
- How to value a company based on EBITDA
- How to value a company based on earnings
- How to find your own valuation multiples
- Other posts on how to value a company
Download Data Set
Here’s a sample of the data set. Toggle between the data set and the averages tabs. Full data set download info below the table.
To download the ~1000 companies data set in this analysis, enter your email address below or if you don’t see it, then click here to enter your email on that page to sign-up for the mailing list and the data set will be sent to your email directly.
Thanks for reading as always and leave a comment if you found it useful!
Would love a copy of the data set.
Thanks for your comment, Alyssa! It should be on your way to your email. Cheers.
Stumbled across your website when looking for multiples data. Found other useful items as well, thank you! Would love to download data for the software tech companies, but it appears that the links to leave an email address are broken on every page, so replying in the comments here is the only way to communicate (unless I want to use the gmail address which you have warned us not to use. See, I really did look all over your website.). Thanks.
Thanks for bringing this to my attention, Paul! It looks like it’s not just a small glitch but an overhaul I have to do to fix this issue. The file should be in your inbox now!
Can I get a full data set please
Sent!
would love copy of data set. thank you.
t should now be up and running and on your way to your email! If not, then there now should be a field for your email address.
Pls forward data set
Should be on its way to your email!
can you send me the data set
Should be on the way to your email!
Can I please have a copy of the data set.
Should be on the way to your inbox now!
Thanks a lot for useful information
Thanks!
Can you please send a full data set copy
Should be on the way to your inbox!
I would love to get a copy of the data set
Should be on the way to your email!
Can I please have a copy of the data set? Thank you! 🙂
Sent!
May I receive the data set? Please
Sent!
Data set, please!
Sent!
My 40 year old M&A firm has traditionally represented manufacturing companies. A few years ago we represented a buyer that acquired a 3.5m sales Saas company. They grew it to 8m and just sold in late 2020 for 7 X sales. In my long career the highest gross sales multiple for a MFG co I ever sold was 1. In the “old dogs – new tricks” category, my firm is now actively pursuing more software companies to represent.
Thanks for sharing your insight, Jim. Looks like the company you represented falls exactly in line with the trend we’re seeing in the market. Are you seeing a lot of activity in manufacturing these days? My recent experience has been acquisition activities between manufacturing and tech to head towards “smart factory”; curious what you’re seeing.
Thanks for such an insightful share! please do share the dataset.
Thanks for reading, Anuja! You can insert your email address in the field at the end of the article and it will be delivered to your inbox directly.
yes pls send 600 company data set as you mentioned
Thanks for your comment! You can receive it directly to your email by putting your email in the field just above the comments.
Could you send me the data set please?
Thanks
Tom
Hi Tom, thanks for your comment. You can input your email in the field at the bottom of the post and hit subscribe, and the data set will be emailed to you automatically. Thanks!
Thanks for the data set – found this really useful. How often do you update these multiples? Would be cool to see recent ones?
Also do you not think its the case that there could be tech software bubble in the potential medium term? Constantly beating the market with massive valuations (understand that the big tech really taken over) – just makes it tricky to value unlisted young/medium term SAAS businesses
Thanks for your comment, Raji! Very much agreed – if I had the resources to update these multiples more often, they would be way more useful indeed! It’s a one-person show here, so please bear with me =). Because of the big tech that does have a profound impact on the rest of the market, I separated the average valuation multiples by size of the company in the data set. I try to update the data set once a year and this post was updated at the start of 2021. Thanks for reading and hopefully I’ll be able to get around to updating this data set again in the near term!
Thank you, valuable data. I would like to sell my 20 year old SaaS business, run without external investment.
Thank you for your comment, Julia! That’s really interesting – do you care to share more about it?
Thanks for sharing this!
Thank you for reading and for your comment, Sylar!
The[sibwp_form id=9] doesn’t seem to be working on this or the list signup page; but I would like to download the data.
I got the email to confirm my subscription to your blog, but no dataset. What do I do now?
There was a glitch, but it should be fixed now. Thanks John.
Can’t enter my email address to download the dataset. The page says:
“enter your email below to sign-up for the mailing list and the data set will be sent to your email directly.
[sibwp_form id=9]
Thanks for reading as always and leave a comment if you found it useful!”
Hi John, thanks for bringing it to my attention. There was a glitch I had to fix. The dataset should be in your inbox now!
Thank you for the information and the valuable data. Could you kindly share the dataset, please?
Hi Moises, it should be in your inbox now!
Thank you very much for this very practical article.
Please enrol me for emailing such articles and data sheets.
Thank you very much.
Thanks Sandeep! It should be in your inbox now!
Love a copy of the data sets please
Hi Kevin, had to fix a glitch. It should be in your inbox now!
Pls send me the data set, this is a very nice article, thanks
Thanks Raghu, it should be in your inbox now!
I’d like to receive the first list
Sent!
I just downloaded the file and Windows Defender blocked it for a trojan horse
Behavior:Win32/PowEmotet.SB
Hi there, thanks for your comment. I think each computer’s firewall treats downloads differently. I’ve set it up so that the file gets sent directly to your email in order to prevent blocks from downloading, but not sure what that’s occurring!
Looking forward to checking out the data set!
Thanks Chris!
Hello, thanks for this great content. Would it be possible to share the dataset? This would be very helpful to me. Like some of the others on this thread, I cannot download the dataset.
Thanks in advance
Thanks Max! I’ve set it up so that the data set sends directly to your email – if you put your email below, it should arrive in your inbox! (If it you don’t receive it, it might’ve ended up in spam.)
Hey, I tried subscribing for the data set but doesn’t seem to work. Are you able to pass it along? Thanks!
Thanks Sean! I’ve set it up so that the data set sends directly to your email – if you put your email below, it should arrive in your inbox! (If it you don’t receive it, it might’ve ended up in spam.)
can you please send me the dataset
Hey Suresh, I’ve set it up so that the data set sends directly to your email – if you put your email below, it should arrive in your inbox! (If it you don’t receive it, it might’ve ended up in spam.)
Hello, thanks for the great article. Would you mind sharing the data set? Thanks!
Hi Deven, thanks for your comment. It should be in your inbox. Or it might have ended up in spam!
Hi, could I get a copy of the dataset. Loading my email didn’t work. Thx!
It should be in your inbox – if not, it might be in your spam!
Could you please send me Data set. Email link not working.
Hi Joe, I put your email in the field. If it doesn’t work, your email might be too protective and rejecting it! Also, it might be in your spam!
Hi would love a copy of the data set! Thx and great work!
Hi Jason, you should receive it automatically if you put your email in the field for the file. Also, check your spam as it might’ve gone there. Thanks for your comment!
Can you please send me the dataset? The link isn’t working for me.
Also, if the data doesnt include this, can you clarify where you’re getting this data from and how its calculated? It would be great to understand where this data is coming from.
Thank you!
Hi Aidan, thanks for your interest in the excel! On rare occasions, it takes a few hours or a day for the email to go through after putting your email in the field. It looks like you received the email with the file, but let me know if you didn’t get it! Cheers-
Can you please send me the data set? It would also be useful to know where this data is coming from if you havent included that in the data set you’re sending.
Thank you!
Hi Alexander, thanks for your interest in the excel! On rare occasions, it takes a few hours or a day for the email to go through after putting your email in the field. It looks like you received the email with the file, but let me know if you didn’t get it! Cheers-