
*DISCLAIMER* This post, the DCF valuation model, and the company DCF excel examples that you can download are NOT investment advice. Do not use any of this article or the example in the model as investment advice. Microcap.co and I am not liable for any decisions you make based on this article, the DCF model, or the company examples.
Discounted Cash Flow valuation method (or better known as “DCF”) is simply one of many ways to value a company.
It’s a method that values a company based on its future promised cash flows, and is often the primary valuation method used when a company is bought / sold.
DCF valuation should be done in conjunction with other valuation methods, such as:
- Public company comparables (or “Comps”)
- Past transaction comps
- Net book value or net asset value
Now let’s get right into how to perform a discounted cash flow valuation.
Discounted Cash Flow Valuation Concept Summary
DCF valuation is simply a way to add up all the cash flow a company will make over the life of the company. That’s it.
To emphasize how simple of a concept DCF valuation is, let me re-type that. DCF valuation is:
A way to add up all the cash flow a company will make over the life of the company
For example, this year after you pay for all the expenses and pay back any interest, let’s say you make $100k.
And next year, you make $100k. And every year after that, you expect to make $100k every year.
When you add up all this cash flow every year for the next 50 years that you operate your company, you make $5 million ($100k x 50 years).
So then, you can say that the company is worth $5 million.
It’s as simple as this except there’s just one more thing to take into account and apply.
We know that one dollar 50 years ago was not the same value as a dollar today.
Similarly, $100k this year is not worth the same amount as $100k in 50 years. In 50 years, $100k will be worth much less.
So, to account for the money not being worth as much later on and because what good is $100k 50 years later when we might not even be around to see it (bleak…), you apply a discount to the cash flow you expect to get in future years.
This concept is called the time value of money (TVM).
So, instead of your company being worth $5 million, it will be worth less than that. Let’s see what that number is in the table below:
| Year 1 | Year 2 | Year 3 | Year 4 to 49 | Year 50 | |
| Cash Flow | $100k | $100k | $100k | $100k/year | $100k |
| If you add it up before discounting: | $5 million | ||||
| Discount for TVM | No discount b/c $100k today is worth $100k | 10% | 10% again | 10% again every year | 10% 50 times |
| Discounting Calculation | 100k / (1.1) | 100k / [(1.1)*(1.1)] | 100k / [(1.1)*(1.1)*
(1.1)] |
100k / (1.1^n) | 100k / (1.1^50) |
| Discounted Cash Flow (Cash Flow after the discounting calculation) | $100k | $91k | $83k | $75k in year 4 to $1k in year 49 | $0.9k |
| Add up the discounted cash flow | $1.1 million | ||||
In the table above, you see that the $100,000 in year 50 is only worth $900 today.
So, instead of the company being worth $50 million, when you add up the discounted cash flow, it’s worth $1.1 million today.
In the next section, we’re going to delve a little deeper with technique and use two real life company examples.
How to do DCF Valuation SIMPLIFIED in 3 Steps
Above was an illustrated summary. Now we’ll perform the DCF valuation with real company examples.
The 4 simple steps to do a DCF valuation are:
- Step 1) Calculate the cash flow
- a) For the last 5 years
- b) For Projected Years 1 – 5
- c) For Projected Years 6 – 50 combined into something called a Terminal Value
- Step 2) Apply Discount
- Step 3) Add it up all up to get the valuation
Step 1) Calculate the Cash Flow
In the above example, we assumed that the hypothetical company would make $100k every year for 50 years. Obviously, this is unrealistic.
Realistically, the cash flow that a company will make this year, next year, and every year after that forever is not known with certainty.
But we need to make this assumption based on what we do know in order to be able to calculate the discounted cash flow and subsequently the company’s valuation.
In order to do that, we calculate the historical free cash flow for the last 5 years, so that we can see the trend and make best guess assumptions.
So, set up the free cash flow calculation for the last 5 years.
a) Calculate Cash Flow for the Last 5 Years
I wrote a post on how to calculate free cash flow, so I won’t repeat it here, but if you need a refresher on how to calculate free cash flow, then pause here and go read that post first.
As a reminder from that post, a simplified illustrative step by step line items to calculate free cash flow is as follows:
| Revenue | $1,000,000 |
| Cost of Goods Sold | ($500,000) |
| Gross Margin | $500,000 |
| G&A | ($300,000) |
| Earnings Before Interest, Taxes, Depreciation & Amortization (EBITDA) | $200,000 |
| Subtract Depreciation & Amortization | ($50,000) |
| Earnings Before Interest, Taxes (EBIT) | $150,000 |
| Deduct Interest | ($10,000) |
| Earnings Before Taxes (EBT) | $140,000 |
| Deduct Taxes (let’s say 35% of EBT) | ($49,000) |
| Earnings After Taxes (EAT) | $91,000 |
| Add back Depreciation & Amortization | $50,000 |
| EAT Before DA | $141,000 |
| Subtract Changes in NWC | $10,000 |
| Subtract CAPEX | ($30,000) |
| Free Cash Flow | $101,000 |
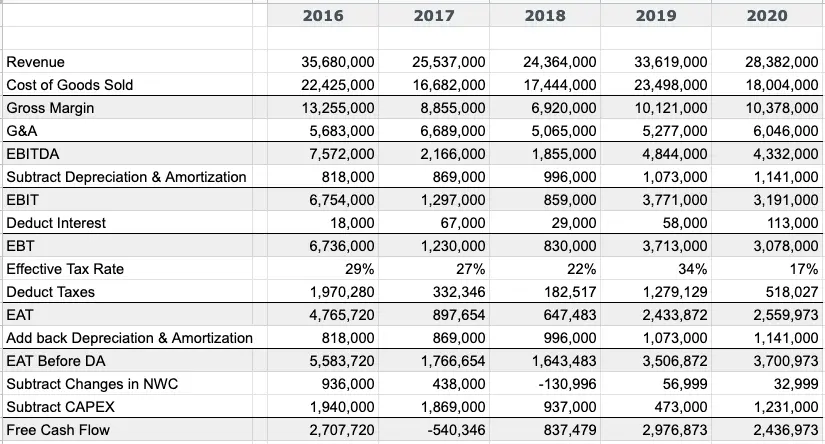
In that post, we looked at 2 real life examples and calculated the free cash flow for 2020 in the case of Taylor Devices and for 2019 in the case of Liberated Syndicated.
Now, in this first step to perform DCF, we’re going to repeat the free cash flow calculation for the last 5 years. That is, 2016 – 2020 for Taylor Devices and 2015 – 2019 for Liberated Syndicated.
Example of the last 5 year free cash flow:
b) Project Cash Flow for Years 1 – 5
After you’ve set up the historical 5 years, you project the next 5 years.
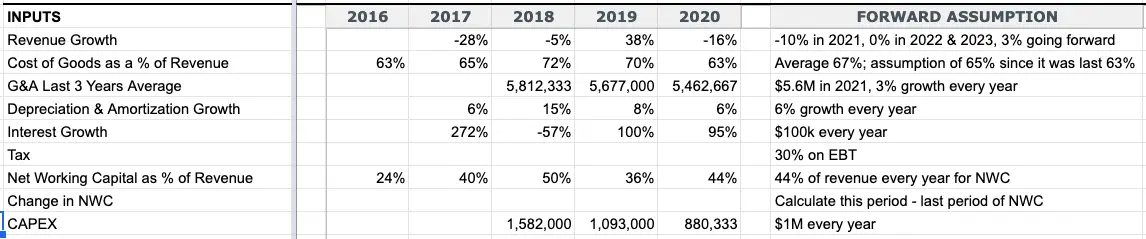
Based on what we know happened, we will make reasonable assumptions for each row that’s an input (not a calculation output), starting at the top with Revenue.
- Revenue Growth: There are 3 things you look at to determine revenue growth. The first is the historical trend of revenue growth (usually average of last 3 or 5 years). The second is internal events that will impact revenue; for example, sales pipeline, new client wins/losses, partnerships, etc. The third is external events that will impact revenue; for example, a pandemic!!! Once you pick a reasonable revenue growth assumption, apply it to the most recent year’s revenue. Apply the same growth rate to the next 5 years, unless you know there will be an increase or a slowdown in growth.
- Cost of Goods Sold as a % of Revenue: Calculate the last 5 years’ cost of goods sold as a % of revenue. Since COGS is a direct cost, meaning it varies with revenue, we should get a pretty level % in this calculation.
- G&A: The last 5 years’ G&A should be pretty stable since operating costs don’t tend to change much unless there are major changes in the company such as layoffs, new business segments or product lines launched, development, etc.
- Depreciation & Amortization: Companies will have a separate Depreciation table that calculates the annual Depreciation & Amortization. If there weren’t any purchases of items to be capitalized (like equipment), then D&A should be similar to last year’s.
- Interest: Interest should also be known in a separate debt / interest table.
- Taxes: Every year’s actual taxes paid will fluctuate based on tax deductions. For future projection purposes, it’s a reasonable assumption to use the corporate tax rate (both federal & state tax) and apply that to EBT.
- Changes in Net Working Capital: There are several ways to make this assumption. In one place I worked at, I was taught to make an assumption as a 1% of revenue. In another place I worked at, I was taught to create a separate working capital schedule and make assumptions on the “Days of Receivables”, “Days of Inventory”, and “Days of Payables” and then derive the working capital based on revenue projection. And at another place I worked at, which I think is probably the more robust way to do it, is this:
- First, calculate the historical cash-free, debt-free working capital as a % of revenue.
- Then take the average of this % of revenue and use it to project the cash-free, debt-free net working capital for future years.
- As the last step, take the change in the net working capital projection. The change is going to be taking THIS period’s net working capital MINUS LAST period’s net working capital.
- CAPEX: The last input to make an assumption is capital expenditure (CAPEX). This assumption is going to be different based on the nature of the business. If the company is in a very heavy machinery industry and the business requires new investments in machinery every 2 years, then CAPEX will be high and predictable. If the business is in software as a service, and the company is heavily investing in developing intellectual property in the next 5 years, then there will be high CAPEX in the form of capitalized R&D in the initial years. The best way to gather information to make a reasonable assumption for CAPEX is to look at historical trend as well as knowing what the company is working on and what their plan is.
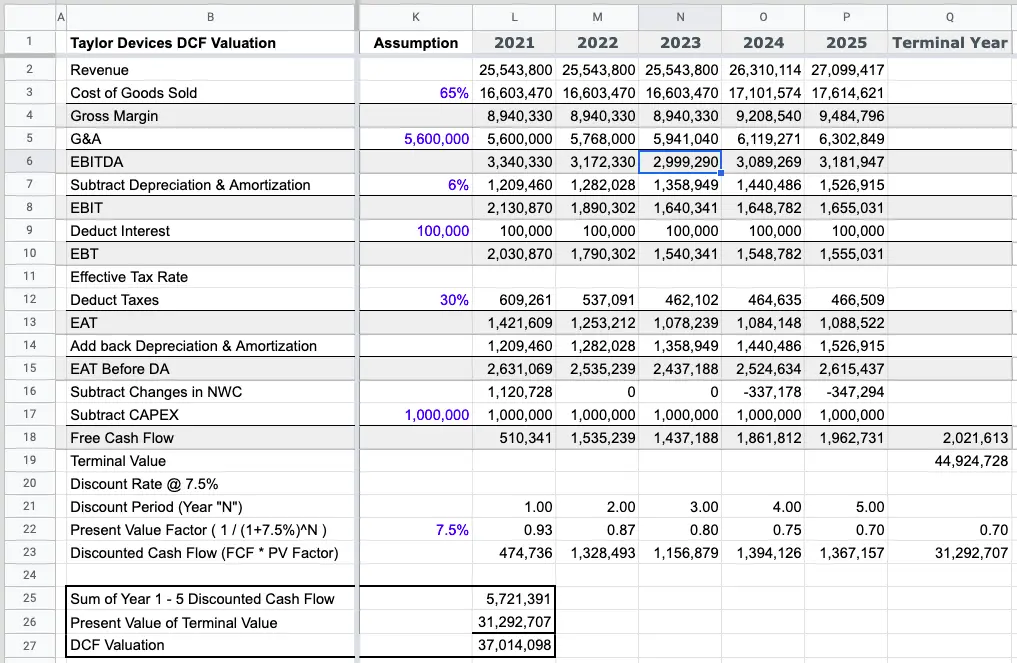
Using our company example, this is how I made a reasonable assumption for each input row after considering the historical trend averages.
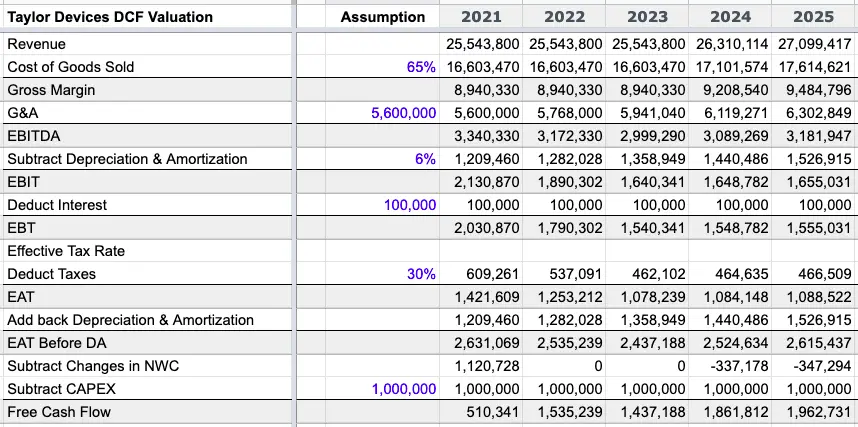
And using these forward assumptions, the projected 5 year cash flow looks like this:
When you’re first building DCF models, it might get a little discouraging when it comes to making the forward assumptions. But it becomes second nature after a lot of practice, so keep going.
And if you’re trying to value your own business, take the time to dig into the operation and ledgers to understand each input and make a robust assumption.
The factors that contribute to making these decisions include the nature of the business, whether you want to be more conservative in your assumption, external and internal factors, etc.
B) Project Cash Flow for Years 6 to Forever (i.e. “Terminal” Cash Flow)
In the illustrated example at the beginning of this post, we assumed $100k every year for 50 years. But who are we kidding; it’s impossible to predict cash flow that far out.
So, instead, we group years 6 onwards into one, which we call the terminal value.
At this point, assumptions you make don’t have that great of a certainty that they will occur since we have no idea what will happen 6 years onwards.
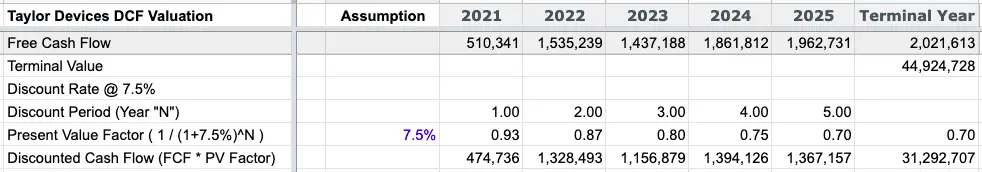
The formula to calculate the Terminal Value, which captures all the cash flow in the future years, is:
- (Free Cash Flow in Year 5 * Terminal Value growth rate) / (discount rate – Terminal Value growth)
- We know the free cash flow from Year 5 in the previous section.
- The terminal growth rate is the long term growth rate that you assume for every year forever. The industry standard for the terminal value growth rate is 3%, because it’s the closest to what the historical trend for inflation every year has been. But for an industry that’s very mature and won’t grow much, it might be 2%. For a very fast growing industry, it might be 5%. But 3% is a safe assumption to use if you don’t know the state of the industry.
- We haven’t talked about the discount rate yet. That’s in the next section. For now, we’re going to use 7.5%. To read more about this discount rate, keep reading on to the next section and then come back to this section.
Below, you can see that the free cash flow for the Terminal Year is Year 5’s free cash flow multiplied by the Terminal Value growth rate of 3% – which is the numerator of the Terminal Value formula. And then we divide this by (discount rate – Terminal Value growth rate), which is (7.5% – 3.0%), which is the denominator of the TV formula. We get ~$44.9M.

Step 2) Apply Discount
Now that you have the free cash flow for Years 1 – 5 projected and the Terminal Year, the next step is to apply the discount; i.e. the “discounted” in Discounted Cash Flow.
To do this, you need the appropriate discount rate and the formulas.
What Discount Rate Should You Use?
The discount rate in the industry is called the Weighted Average Cost of Capital (or WACC).
WACC calculates each company’s cost in % per year for borrowing money or getting investors’ money.
We won’t worry about WACC now, because this is more technical than practical. Instead, I would encourage the use of Professor Damodaran’s regularly updated discount rates by industry, because he does the research and calculation for us. =)
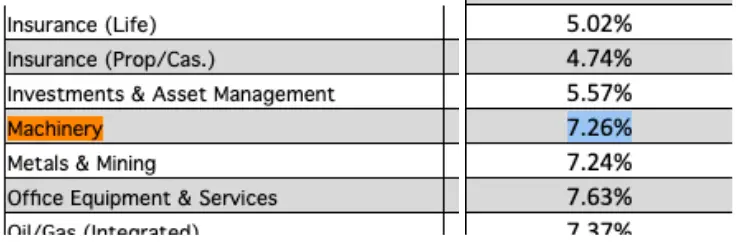
On his NYU webpage, look up the industry in which the company you’re valuing operates in.
At the very far right column, you’ll see “Cost of Capital”. That’s the discount rate we’re going to use.
Our example company operates in heavy industrial machinery. The cost of capital in the table is 7.26%. As a simplified discount rate, we’ll round up and use 7.5%.
Apply Discount Rate to Cash Flow in Years 1 – 5
Assuming today is Year 0:
- In Year 1, we’re going to divide the cash flow by (1+ discount rate).
- In Year 2, we’re going to divide the cash flow by (1+discount rate) twice.
- In Year 3, we’re going to divide the cash flow by (1+discount rate) three times.
You see the pattern.
So, the formula is cash flow in a given year is
- Free Cash Flow / (1 + discount rate)^(year N).
If we’re assuming that Year 1 has already started, then we get into a “partial period”, which for the purpose of a simplified understanding of DCF, we don’t have to get into yet.
I like to break the formula up into simpler rows:
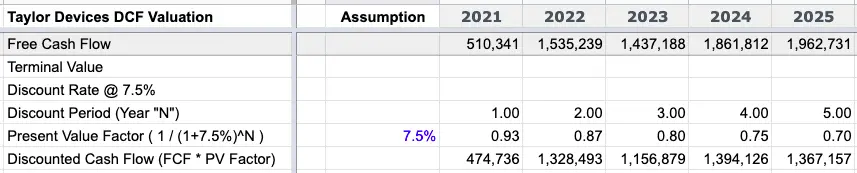
- “N”; i.e. the period being discounted: Count the # of years from Year 1 to the given year.
- Present Value Factor is the denominator of the discounting formula.
- Present Value is now bringing in the numerator of the discounting formula which is the free cash flow; i.e. the Discounted Cash Flow.
Apply Discount Rate to Terminal Value
Discounting the Terminal Value is exactly the same. Since the Terminal Value adds up Year 6 to infinity, it doesn’t belong to any year. We use Year 5’s present value factor to discount it.
- I.e. $44.9M * 0.70, which is $34.0M
Step 3) Add It All Up
Finally, the best part. We add up all the discounted cash flows to get the company’s valuation.
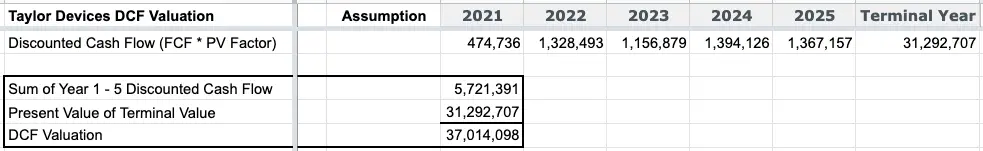
The valuation of this company using DCF valuation method is $37.0M.
Congratulations, you’ve just built a DCF model and valued a company based on projected cash flow. Here’s a star.
Download Discounted Cash Flow Excel Examples
In the Excel model examples that you’re about to download, you will find Taylor Devices and Liberated Syndicated.
The 2 companies are good varying examples because of some differences you’ll notice. For example, LibSyn is a podcast hosting company, so it doesn’t normally spend CAPEX unlike Taylor Devices which has a relatively high amount of CAPEX every year since it’s a heavy machinery company.
You’ll find a simple DCF model for Taylor Devices like this:
And a DCF model for Liberated Syndication like this.
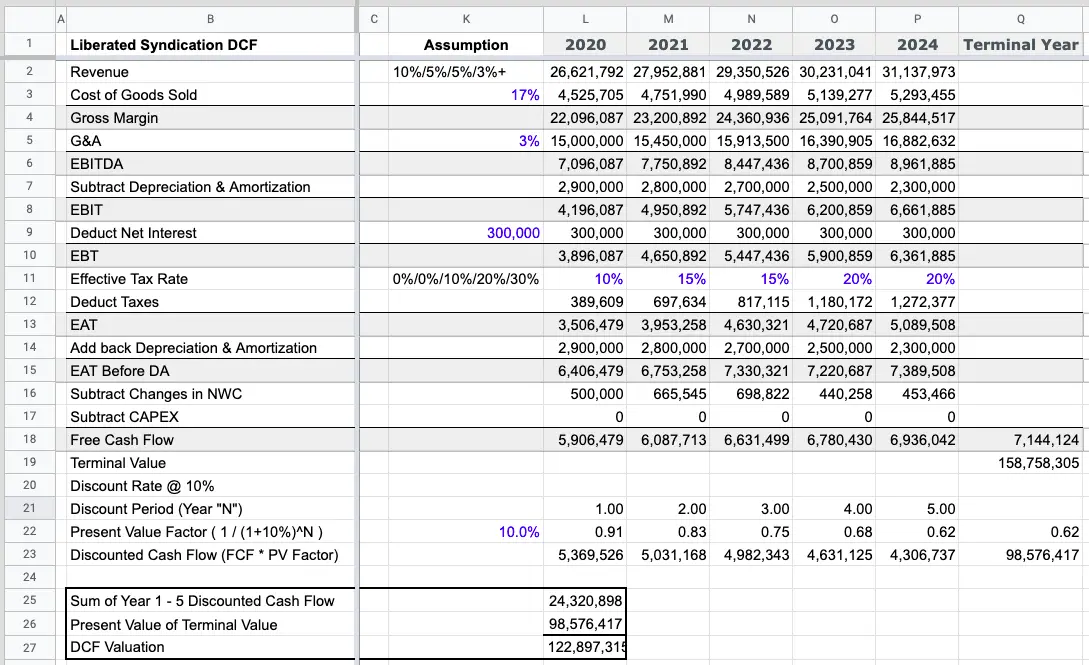
Note that there may be some mistakes as I am human and there might be human error that I didn’t catch. (Also, I created it in Google Sheets as opposed to my beloved Excel, because I am currently using a different laptop than I normally do to create models. So, if you find any mistakes, forgive me.)
Finally, here is the model. Enter your email below to download the Discounted Cash Flow model with real company examples. The model with the 2 company DCF examples will be sent to your email directly.
As always, thanks for being a reader of microcap.co and leave a comment and share with friends and colleagues who want to value a business.
*DISCLAIMER REPEATED* This post and the excel examples are by NO means investment advice. Assumptions made are purely my opinion and the valuation is created using the widely used DCF valuation technique. Do not use any of this article or the example in the model as investment advice.