
Diversified financial services companies provide a wide range of financial services to their customers.
These services may include banking, investments, insurance, retirement planning, estate planning, credit counseling, and they include services to commercial clients or individual retail clients.
This analysis had a data set of 482 diversified financial services companies, and they ranged in size from $100k in market cap to over $150 billion.
I only included profitable US, Canada, UK companies that were publicly traded and I removed data if they were not available, were outliers (or did not fit the trendline).
Below is a summary of the financial services valuation multiples.
Financial Services Valuation Multiples
The most common financial services valuation multiples used are revenue multiple (P/S), price to book ratio (P/BV), and the price to earnings (PE ratio).
P/S Multiple
The average and median revenue multiple (or price to sales ratio) for 400+ companies are 3.4x and 3.3x, respectively.
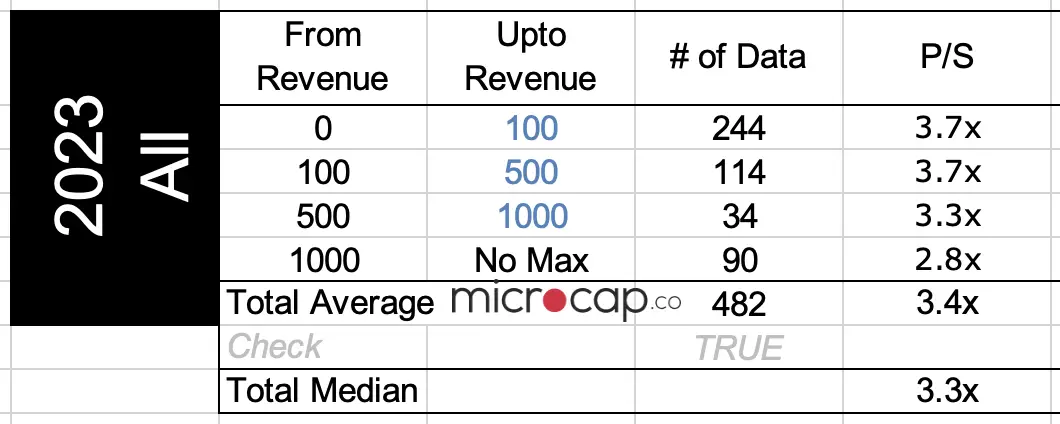
As the size of companies increased, the revenue multiple decreased, which is interesting, because you would expect there to be more economies of scale with larger companies and be given a higher valuation.
P/BV Multiple
Another measure that is common for financial services valuation multiples is the price to book value ratio (P/BV).
Book value is the company’s assets minus their liabilities. For financial services companies, their assets and liabilities are essentially all made up of monies.
So, the book value is above 1 if their assets are higher than their liabilities, and that is an indicator of how well the firm manages their money.

The average and median P/BV multiple for financial services are 1.3x and 1.0x, respectively.
As the size of the financial services company increases, the P/BV ratio increases, and this is perhaps a better measure to illustrate a financial services economies of scale than the revenue multiple.
PE Ratio
The third most common financial services valuation multiples indicator is PE (price to earnings) ratio.
The PE ratio is a good indicator of the health of a financial services firm because it measures how much the market is willing to pay for the firm’s earnings.
This metric provides insight into the market’s perception of the firm’s ability to generate profits in the future.
For example, the market takes into account factors such as the firm’s competitive advantage, profitability, and growth potential to determine the market’s valuation, and earnings is what indicates profitability.
A high P/E ratio suggests that the market is optimistic about the firm’s future prospects, while a low P/E ratio suggests that the market is less confident in the firm’s ability to generate future profits.
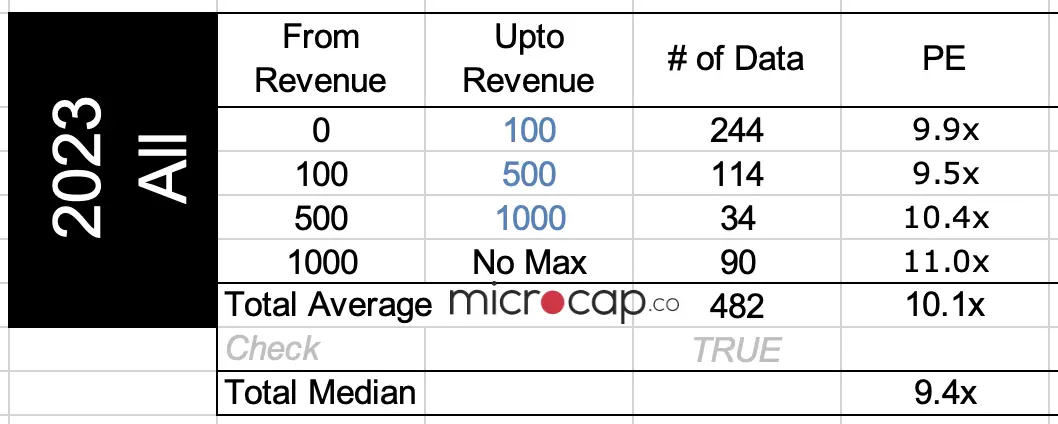
The average and median PE ratio for financial services valuation multiples are 10.1x and 9.4x, respectively.
In the data set, as the size of financial services companies increased, the PE ratio increased as well.
Other Valuation of Financial Services Companies
In addition to the common financial services valuation multiples, return on equity (ROE) and dividend yield are also common metrics used to value financial service companies.
Return on Equity
Return on equity is a financial ratio that measures a company’s profitability in relation to its shareholders’ equity.
ROE is calculated by dividing the company’s net income by its shareholders’ equity.
ROE is used to measure how efficiently a company is using its assets to generate profits for its shareholders, so it is a key indicator of how well the company is benefiting their shareholders.
So, comparing ROE among similar companies can help to value the financial health and performance of the company you are valuing.
ROE can also be used to gauge a company’s potential for future returns, and as such, it can be used to value a company.
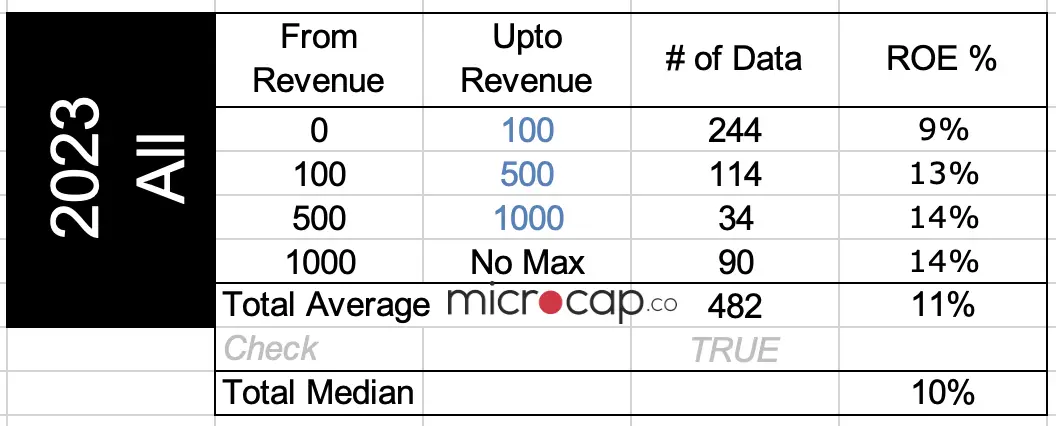
The average and median ROE % for financial services companies are 11% and 10%, respectively.
As the size of the financial services companies increased, the return on equity increased as well.
Dividend Yield
The next and final way to determine the financial health and valuation of a financial service company is my favorite, which is using the dividend yield.
The dividend yield of a company is a ratio of how much a company pays out in dividends relative to its share price.
It is calculated by dividing the company’s annual dividend by its current stock price.
This ratio can be used to compare the dividend yields of two different companies and can also be used to assess the value of a company’s shares.
A higher dividend yield indicates that the company is paying out more money to shareholders, which can be an indication of a company’s financial strength and stability.
Investors can use the dividend yield to evaluate the potential returns of an investment and make informed decisions about whether or not to buy a particular stock.
The reason why the dividend yield is my favorite way to measure a company’s financial health is because it is a direct indicator of how much I can expect to earn in dividends if I invested in this company.
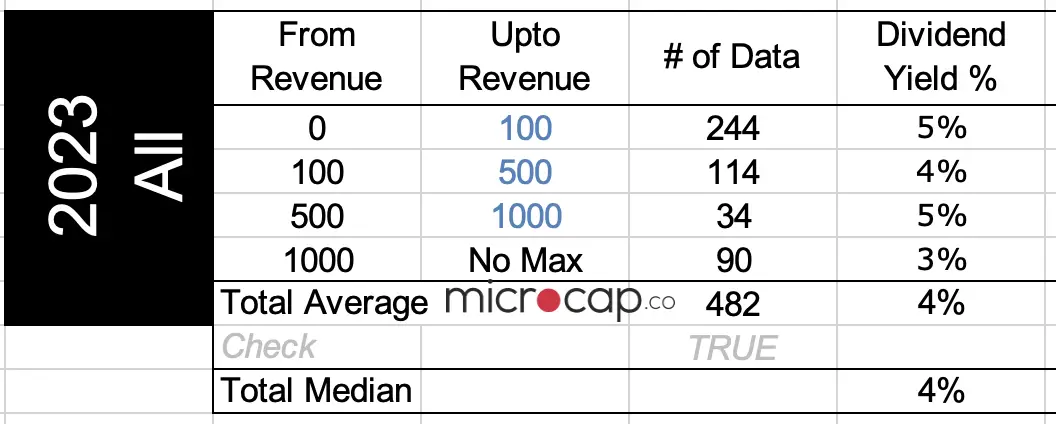
The average and median dividend yield of financial services companies is 4%.
Interestingly, the dividend yield is pretty consistent across the different sizes of financial services companies and it is hard to tell whether larger companies have higher dividend yields.
One thing that this analysis does not tell you though is how the financial services companies have changed their dividend yields over time.
Usually, the larger the companies, the more stable the dividend yield is over time.
How To Use Valuation Multiples To Value a Company
For those who are not familiar with using valuation multiples to value companies, I wrote posts detailing exactly how you can do that.
Hopefully you can use them as helpful guides. Click on the link below to go to the post.
- How to value a company based on revenue
- How to value a company based on EBITDA
- How to value a company based on earnings
- How to find your own valuation multiples
- Other posts on how to value a company
Download Data Set
To download the 400+ companies data set in this analysis, enter your email address below to sign-up for the mailing list and the data set will be sent to your email directly. In some cases, it takes a few hours or a day to receive the email with the data set.
(I have never sent an email to the mailing list, but I may in the future, who knows. But the reason for mailing it directly is because if you can download it with a click of a button, the internet bots go nuts.)
Thanks for reading as always and leave a comment if you found it useful!
