
Another valuation method that is supplementary to the Discounted Cash Flow (DCF) method is relative valuation, aka “comps” or comparable multiples.
What Is Relative Valuation Used For?
The comparable multiples valuation method is primarily used in 2 ways:
- Stock investing – to gauge whether a public company is undervalued or overvalued; and
- Transaction price setting – to determine the right price to sell or buy a company
Whereas DCF valuation method looks at the underlying cash flow that the company is expected to make over time, relative valuation does not look at the company’s internal performance.
If you take apart the words “relative valuation,” it does just that – you’re valuing the company relatively to its peer companies.
Why Comps?
In both stock investing and transaction price setting, relative valuation is important to use, because you can analyze the company’s intrinsic valuation all you want, but if the market is not willing to pay for it, then the intrinsic valuation from analyzing underlying cash flows doesn’t matter.
For example, in stock investing, let’s say a public company’s DCF valuation says it’s worth $10 million, and the market cap is $5 million. Then, you might be tempted to buy this stock because you think it’s undervalued relative to what it’s worth.
But, upon closer inspection, you realize that compared to its peers, this company’s multiples are trading at overvaluation. That’s a signal that the industry itself is not valued high for whatever the reason might be.
So, you can buy the stock but if the market thinks the industry sucks, then the stock will never rise even if its DCF valuation says otherwise.
Similarly, if you use comps to determine a company’s appropriate selling price, the company’s intrinsic valuation from DCF method might be $10 million. But using multiples in the relative valuation method, the company’s valuation might be closer to $5 million.
In that case, you can try to sell your company all you want at $10 million, but nobody is going to buy the company at that price, because the buyer will think it’s overpriced.
Comparable Public Company Multiples vs Precedent Transaction Comps
Public comps is when you look at public companies’ multiples. These are also called “trading multiples”. E.g. Price to Sales is market cap divided by the company’s revenue of a publicly trading company. This is an example of a public comp.
Precedent transaction multiples is when you look at multiples of companies that have been bought and sold and the company’s underlying performance.
For example, if a company was sold for $20 million and the company’s 12 month revenue was $10 million, then the Price to Sales is 20 / 10, which is 2x.
The main difference between the two is that public comps is based on the company’s market cap; i.e. how much the market is paying for the company’s stock vs precedent transaction comps actually uses what one party paid for the company they acquired.
Precedent transaction comps include more due diligence of data that the acquiring company was privy to during the due diligence phase whereas public comps is based on the financial reports that the public company releases and how investors interpret the financial reports.
As explained above, comparable company multiples are used to either gauge whether a company is overvalued or undervalued or to apply the multiples to find out what the company’s valuation is.
When using multiples to gauge if a public company is overvalued or undervalued, you tend to use just the public comps.
And, when using multiples to set the company’s price to sell or buy the company, you tend to use both, because transaction comps factor in premiums or discounts in the industry when a company is bought or sold.
How To Calculate Comparable Public Company Multiples
- Look for the closest competitors that are public companies – choose between 10 – 15
- For free databases, I would suggest Yahoo Finance, FinViz, TradingView, TD Ameritrade’s stock screener. You can set the industry or sector there and set the range in size of the company with market cap criteria.
- When you get a big list of competitors, filter through and pick only the companies that are the closest in the product or service they sell relative to the subject company you’re trying to value. To get this data, you might have to just google each of the companies or go to their website to get a description of what they do.
- Choose which multiples to focus on
- Which multiples to use to value your company depends on the industry and the maturity of the company in terms of a company’s lifecycle.
- I would suggest a google search on “common multiples” or “common market metrics” for [x] industry.
- The most common multiples across all industries are Price to Sales, Price to Earnings, Enterprise Value to EBITDA.
- Gather the data
- For every comparable company you choose, look up the financial metric on either Yahoo Finance, or Google Finance, or the company’s financial reports that you can obtain on their website.
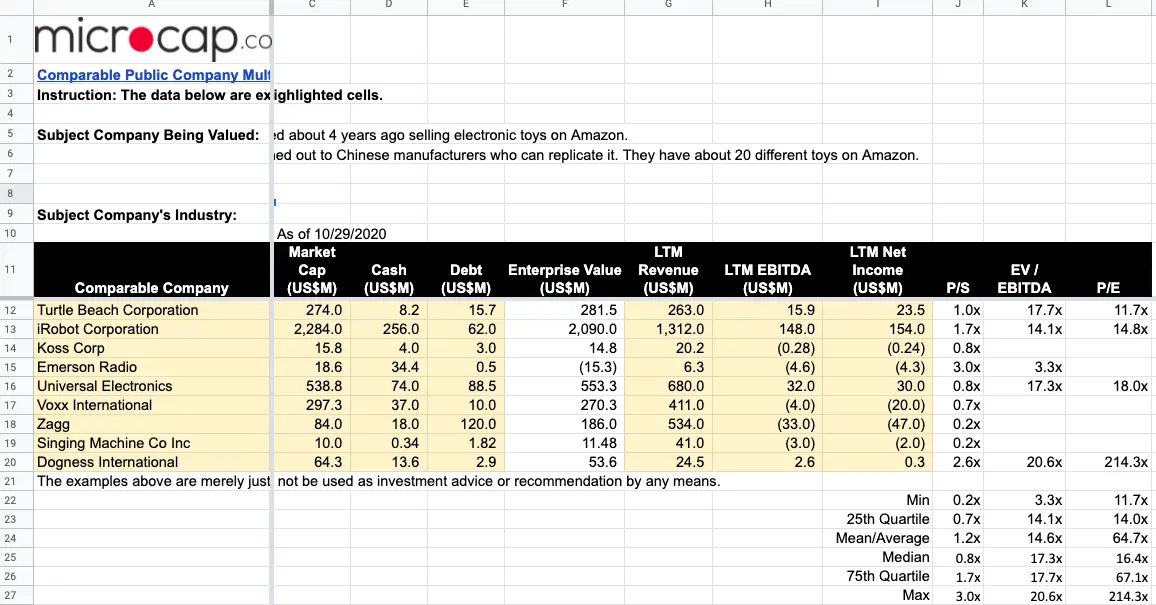
- Fill in the template with the data you gather. [You can download the template at the bottom of this post]
- Compare the Comps
- Take out the outliers – if the multiples of some companies are ridiculously high or ridiculously low (like below 0.1) because their underlying numbers are either erroneous or the company is not in a position to have positive earnings, for example, then take those out.
- Calculate the average, median, min and max to set the parameter, and I also like to do 25th and 75th percentile to narrow the parameter.
- The median and average multiples tend to be pretty close. If they’re way off, I would suggest looking into the underlying numbers as to why. But for most cases, you can use median (or half way between median and average).
- Now, you can use the multiples in 2 ways:
- Use the median multiple and multiple it to the subject company’s underlying number to determine the relative valuation of the subject company.
- Compare the subject company’s multiple if it’s a public company, and compare it to the median of the comparables to determine if the company is overvalued or undervalued.
How To Calculate Precedent Transaction Multiples
If you don’t have a $20k/year database like CapitalIQ or a Bloomberg terminal, pulling this data is going to be more difficult. One way to do it is to google search terms like [SaaS company transactions in 2019] and see if there are any news releases that indicate how much a company was bought for and their revenue.
This is like finding a needle in a haystack though… and repeating it 10-15 times.
I’ll leave a question to you guys: would past transactions data by industry be something you’d want to see? If so, then leave me a comment with the industry you’re looking for this data on, what the subject company you’re trying to value is, and what you want the data for.
If it’s worth researching and putting together in a post for you to download, then I’ll consider doing it.
Example Comparable Public Company Multiples Calculation & Template You Can Use [Download]
The example private company I’m going to value is a small business that started about 4 years ago selling electronic toys on Amazon.
They started looking up the most popular electronic toys on Amazon and reached out to Chinese manufacturers who can replicate it. They have about 20 different toys on Amazon.
Their annual revenue is about $5 million.
Using the free screener, I looked up the closest competitors.
The free tools I use to screen the companies are unfortunately not going to give me the exact comparable companies I’m looking for, so I have to do some refining manually.
Here are my search criteria filters on the different stock screeners I mentioned above:
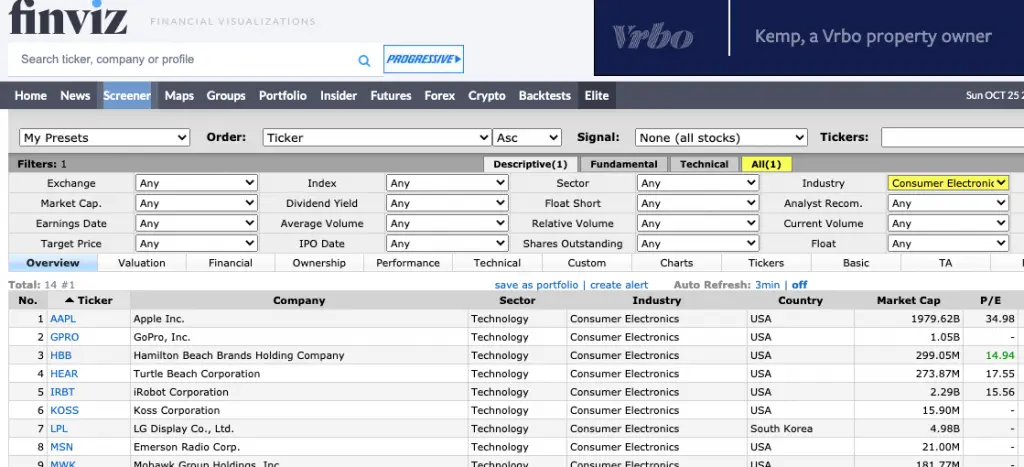
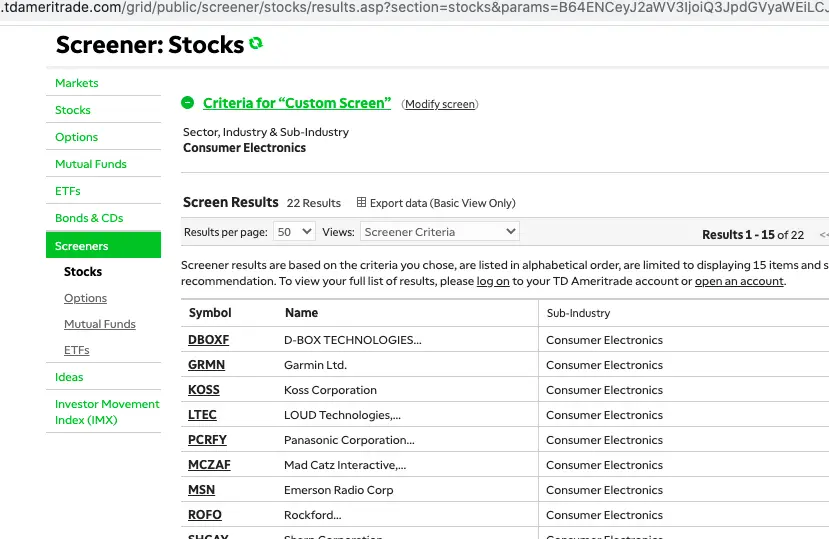
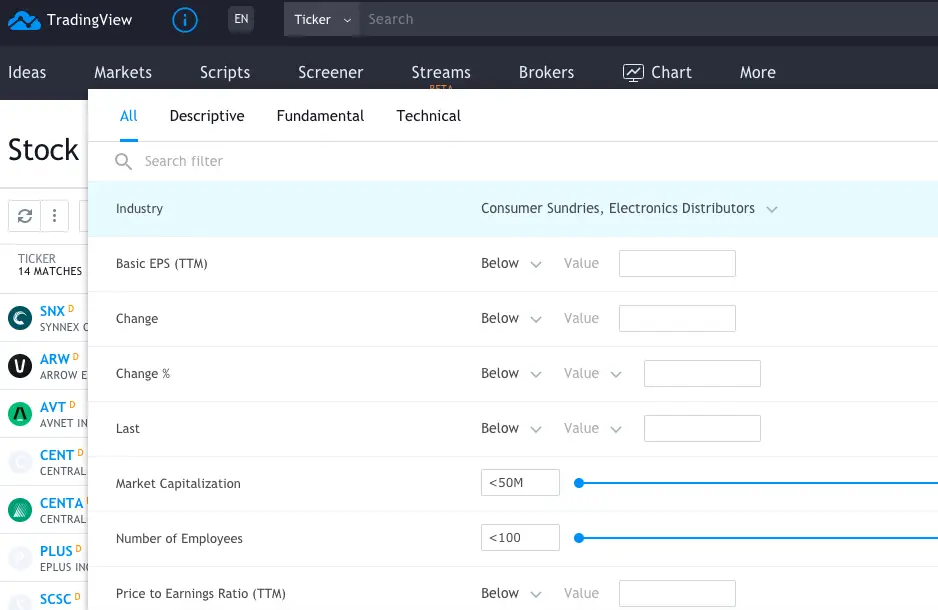
As you can see, sectors and industry criteria I can choose are very broad and different across the platforms. So, now I have to look up the companies one by one to choose the right ones.
Once I had the competitors, the rest was to look up the data one by one.
They’re not the best competitors because they’re too big and they’re focused on more complex consumer electronics. But, you can apply discounts to factor in your subject company being much smaller and the industry being much narrower.
The point of relative valuation is to get you a ballpark and to triangulate the DCF valuation using its underlying cash flows. For that reason, even if the competitors you use in the comparable companies list are not perfectly aligned, it’s a good enough gauge.
You can see the data that I filled out for this example using the comparable companies in the template that you can download here: