
The pet industry has continuously grown year over year since 2018. In 2020 during the pandemic lockdown, industry revenue accelerated due to a 40% increase in pet adoption and fostering.

Increased projected growth in revenue translates to higher valuation given by investors.
This analysis includes a dataset of 17 public pet industry companies listed on major US exchanges. There is only a limited number of companies, so the valuation multiples and margins are not very reliable. But it is still worthwhile considering it.
The dataset includes (1) pet product retail companies, whether it is 100% ecommerce like Chewy or a combination of ecommerce and brick-and-mortar like Petco, or pure brick-and-mortar as well as (2) veterinary services.
Pet Industry Margins
Overall, the pet industry margins are relatively low across industries at large at 31% median gross margin, 6% EBITDA margin, and net profit margin of 3%.
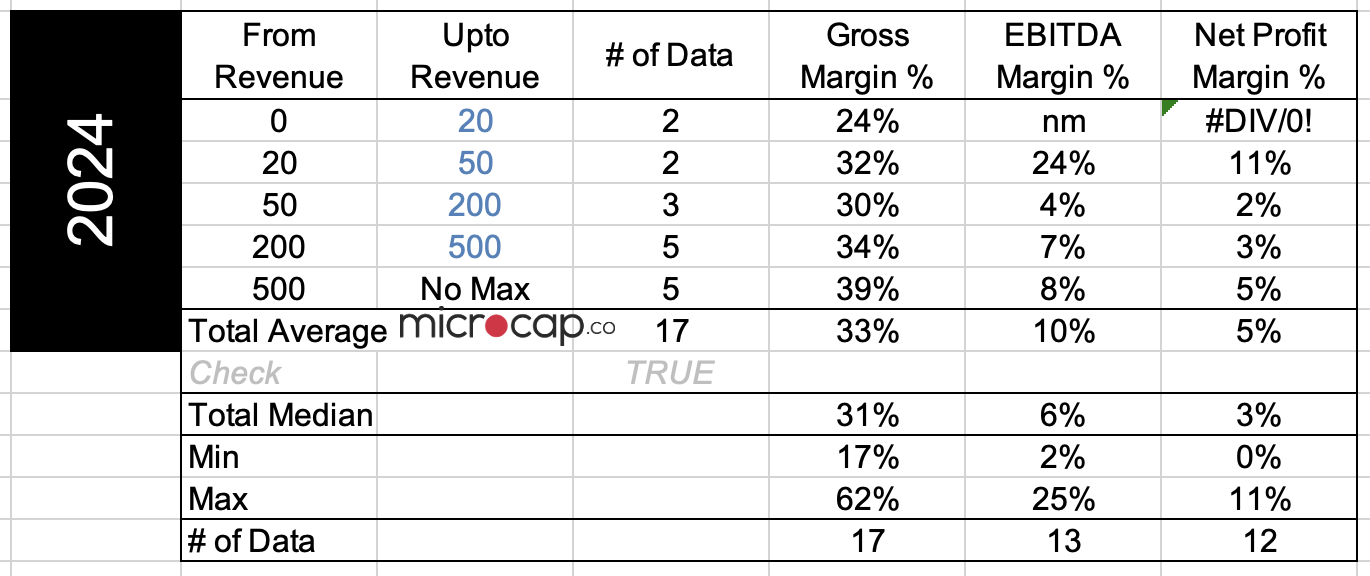
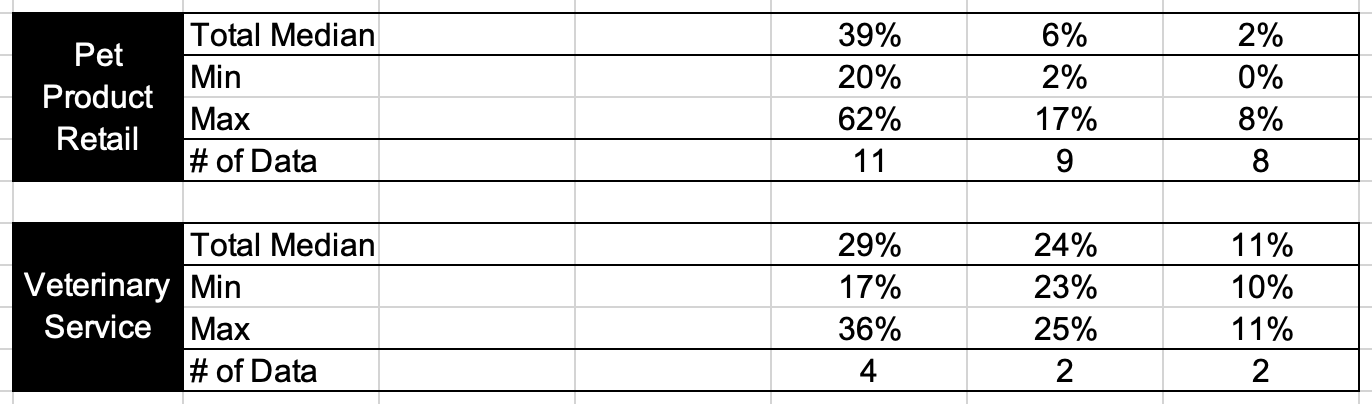
Further, pet product retail companies have higher gross margin but they have lower median net profit margin of 2%.
Veterinary service companies (although there are only 4 in the dataset and only 2 available for EBITDA margin and net profit margin) had lower gross margin but higher net profit margin of 11%.
Pet Industry Valuation Multiples
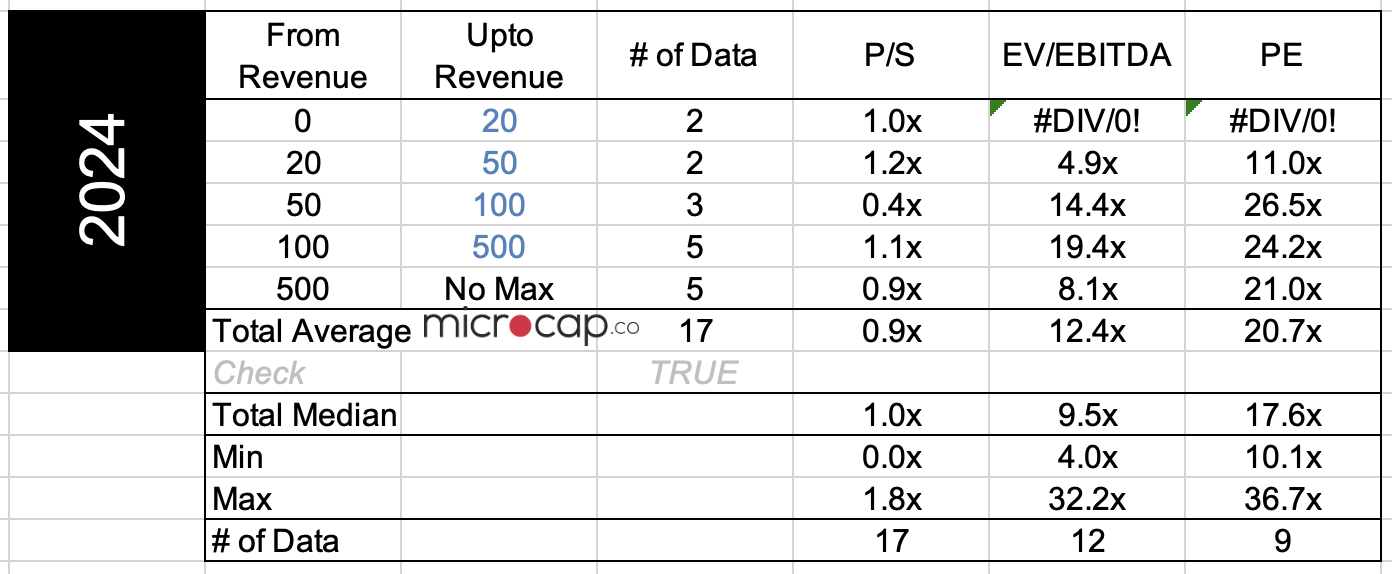
17 pet companies in the dataset in 2024 returned a median revenue multiple of 1.0x, a median EBITDA multiple of 9.5x, and a median PE ratio of 17.6x.
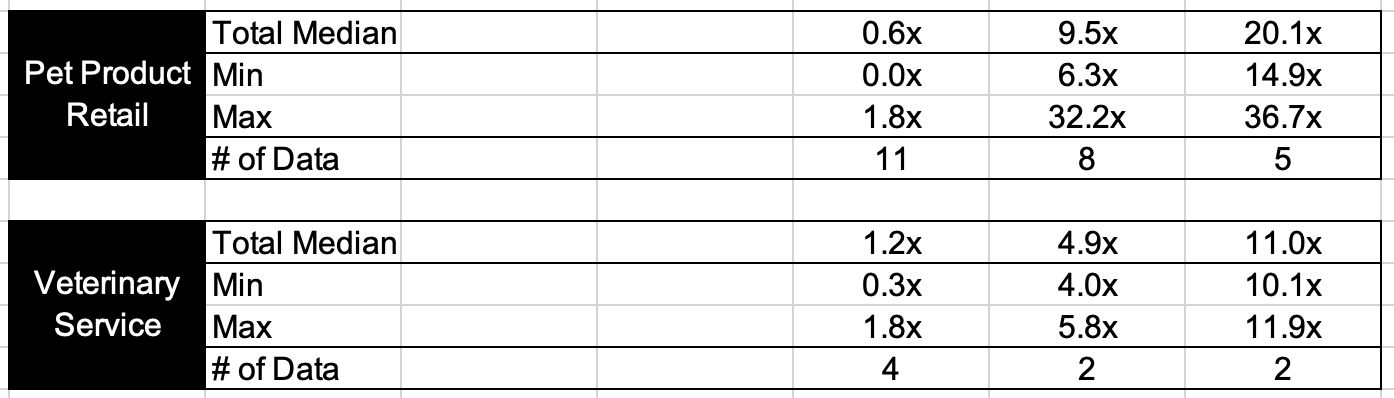
Veterinary services showed higher revenue multiple of 1.2x but a lower EBITDA margin of 4.9x whereas pet product retail companies showed revenue multiple of 0.6x and EBITDA margin of 9.5x.
Pet Industry Outlook 2025
The pet industry is further projected to experience modest growth in 2025, with spending expected to increase by approximately 3.9% and is expected to continue its upward trajectory, with spending growth potentially reaching 7% annually by 2030.
The industry is set for a surge in mergers and acquisitions, thanks to better market conditions and more high-quality businesses becoming available.
Technological advancements, including ‘pet tech’ products like fitness trackers and automatic feeders, are also contributing to market expansion.
Refresher: Value a company using revenue, value a company using EBITDA.
Download Data Set
To download the 17 companies data set in this analysis, enter your email address below to sign-up for the mailing list and the data set will be sent to your email directly. In some cases, it takes a few hours or a day to receive the email with the data set.
