
Valuing an insurance company involves more than looking at valuation multiples for insurance companies.
As a disclaimer, I’m not an expert on insurance companies, but from learning more about how experts value insurance companies, there are two popular metrics to value an insurance company.
One metric is to look at price to book value (P/BV) and the other is return on equity (ROE) (You can read more in detail here: Investopedia).
Given that these are the metrics to look for in valuing insurance companies, I gathered the average P/BV and ROE data as well as the valuation multiples for insurance companies in the US.
The following benchmarking metrics can be used to compare an individual insurance company you want to value and see if its metrics fall within range of the benchmarked companies.
The data set (which you can download below) was pulled from Capital IQ on September 7, 2021, with the criteria: Insurance company, US exchange listed, has sufficient metrics data available, with outliers removed, and with negative, not meaningful numbers removed.
This resulted in 116 companies. Here’s a snapshot of the summary financial benchmark metrics.
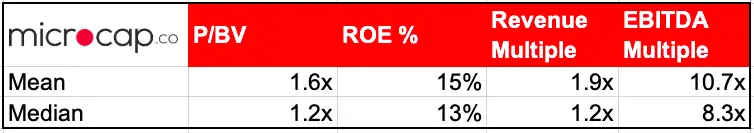
The average range of price to book value for US insurance companies in 2021 is 1.2x – 1.6x. The average range of return on equity for insurance companies in 2021 is 13% – 15%. The average range of revenue multiple for US insurance companies is 1.2x – 1.9x. The average EBITDA multiple range for US insurance companies is 8.3x – 10.7x.
Let’s discuss each multiple below.
How Did Insurance Companies Do During the Pandemic?
Insurance companies faced challenges in the pandemic. While most insurers have adapted quickly, there are many that are still facing obstacles to growth and profitability in the near term (Deloitte research).
More specifically, with the rise of hospitalizations and due to Covid, insurance companies were busy getting calls from customers about changing coverage and insurance claims and overall having to shift their entire operations remotely (PwC research).
But because the nature of insurance companies is in the business of risk analysis, many insurance companies had already been preparing for catastrophic events by bolstering their businesses with things like adding digital platforms to make their operations more efficient (PwC research).
Another stress put on the insurance companies is the low interest rates and a volatile capital market, which has impacted and may impact the performance of their investments (i.e. their investment portfolios from the consumers’ monthly premiums which is used to increase their assets) (S&P research).
One of the trends seen in the insurance industry is investment into more digital transformation and research and development into AI (artificial intelligence) technology. As AI, machine learning and other digital technologies become integrated into the industry, insurance companies will become more resilient and weather any storm (McKinsey research).
Average Price to Book Value Ratio of Insurance Companies
Book value is the company’s Assets minus Liabilities, excluding goodwill and intangibles; i.e. it is basically Shareholder’s Equity minus goodwill and intangibles.
The book value of an insurance company will essentially be the money they have left over after they pay out all their customers’ insurance claims and pay back any debt.
You’d want this book value to be as high as possible, since it’s the remaining money left for the company if they liquidated all their assets, paid out all the claims and paid back debt.
If the book value is the denominator in the ratio, you’d have a smaller price to book value ratio as the book value gets bigger and bigger.
So, the lower the price to book value ratio, the better financial position the company is in.
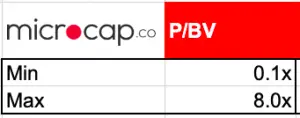
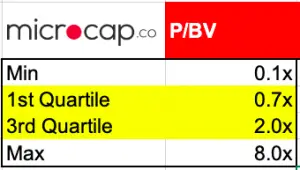
In the data set of 116 publicly traded US insurance companies, the price to book value ratio ranged from 0.1x to 8.0x.
This is a very wide range, so if we haircut the lowest 25% and also remove the highest 25%, then the narrower range around the middle is 0.7x to 2.0x.
The rule of thumb is that a P/BV ratio of around 1 is a good financial position and if the P/BV is closer to 2, then the insurance company is either too richly priced as a stock, or the company is not in a great financial position.
The average P/BV value in the dataset of 116 is 1.6x and the median P/BV value in the data set is 1.2x. When I worked in Valuations, we took the average of the average (i.e. mean) and median when using it as a comparative benchmark.
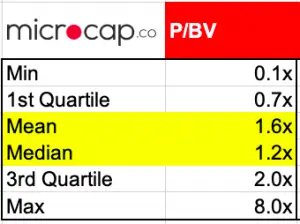
So in this case, the “average” P/BV value of insurance companies in the US is 1.4x.
This is in line with the industry rule of thumb that P/BV of 1 is good and 2 is not very good, since the dataset of 116 companies returned an average right in the middle.
This is also in line with Professor Damodaran’s data analysis of the industry where the average P/BV ratio for general insurance companies is 1.45x.
As a recap, the price to book value of US insurance companies in 2021 averaged around 1.4x. So when valuing an insurance company using the P/BV, compare it to the 1.4x benchmark to see if it is above or below the average.
As I always mention though, a financial metric or a benchmark alone doesn’t reveal the full story of the company’s financial position or the general health of the company.
So, keep digging through their financial statements and news releases to understand more about their fundamental valuation.
Average Return on Equity of Insurance Companies
Now moving on to return on equity (ROE), as a refresher, ROE is measured by dividing the annual Net Income by the company’s Shareholders’ Equity (i.e. Shareholders’ Equity = Assets minus Liabilities).
According to this article on insurance company valuation, “an ROE around 10% suggests a firm is covering its cost of capital and generating an ample return for shareholders. The higher the better, and a ratio in the mid-teens is ideal for a well-run insurance firm.”
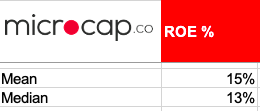
As of towards the end of 2021, the average and median ROE of insurance companies in the US was 15% and 13%, respectively.
It’s interesting to see that despite a lot of stir in the insurance industry due to the pandemic, the average ROE of insurance companies is above 10%, which means they have enough to pay back its lenders and shareholders.
These ROE numbers are much higher than what Professor Damodaran has from his data analysis of 1.5% for general insurance companies, 5.7% for life insurance companies, and 9.2% for property/casualty insurance companies.
However, his data are from January 2021, which was when the world was still bleak and in lockdown during the pandemic vs. my dataset above is from September 2021.
It’s hard to believe that ROE would go up that much higher, so I would triangulate the data from different sources if you were using this in your own analysis.
It will be interesting to see which way these numbers go once the pandemic is “officially” over, which won’t be anytime soon.
Average Revenue Multiple and EBITDA Multiple of Insurance Companies
Finally, here are average/median revenue multiples and EBITDA multiples of insurance companies.
As mentioned in the beginning of the article, the insurance industry has a different, more nuanced way of valuing companies, including the use of ROE and PB ratios.
But, revenue multiples and EBITDA multiples are basic valuation ratios that provide a basic, but solid look at the financial health of the company, so here they are.
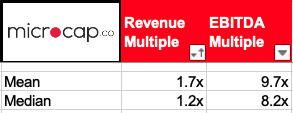
The mean/median revenue multiple is ~1.5x and the mean/median EBITDA multiple is ~9.0x.
Professor Damodaran’s analysis results in a slightly higher EBITDA multiple of 9.7x – 12.5x depending on the type of insurance company.
This could be due to the time of when the analysis was conducted or the screening criteria of companies in the dataset.
How To Use Valuation Multiples To Value a Company
For those who are not familiar with using valuation multiples to value companies or those who are but need a refresher, I wrote posts detailing exactly how you can do that.
Hopefully you can use them as helpful guides. Click on the link below to go to the post.
- How to value a company based on revenue
- How to value a company based on EBITDA
- How to value a company based on earnings
- How to find your own valuation multiples
- Other posts on how to value a company
Download Data Set
Thanks for reading all the way to the end. I hope you found this article helpful.
Per usual, you can download the full data set. Enter your email address below to subscribe and the file will be sent to you directly.