
[This is a part of a series on performing financial analysis of a company. If you want to skip ahead to more advanced level of the series, then check out the other parts. Also, this is a long ass post, so I suggest you get some coffee and pay attention to this highly useful content.]
As discussed in Part 1 of the Financial Analysis series, a Balance Sheet is one of 3 sections in a financial statement to analyze the financial health of a company.
Before we get into the analysis, let’s first briefly break down the anatomy of the balance sheet, so that you understand why we use the numbers in the financial analysis.
Note: I’ll be using Etsy’s balance sheet as an example of a real-life company financials to illustrate the points.
Table of Contents – Click to Jump to Section
- Balance Sheet Basics – Definition of Items
- How to Analyze a Balance Sheet
- Balance Sheet Analysis: Liquidity
- Balance Sheet Analysis: Operating Performance
- Balance Sheet Analysis: Management Strategy
- Summary
Balance Sheet Basics – Definition of Items
A balance sheet is a snapshot of a company’s financial position of their assets, liabilities, and equities on a given date.
It is most helpful in giving us a look into the company’s liquidity and working capital positions. This means how much cash a company has and how well they’re managing their inventory ahead of sales for example.
Analyzing the balance sheet also allows you to get a better picture of the business model, a bit about their customer profile, and how the operator/management conducts business in terms of strategic direction.
Let’s look at each section of the balance sheet and what the key items under each section represent.
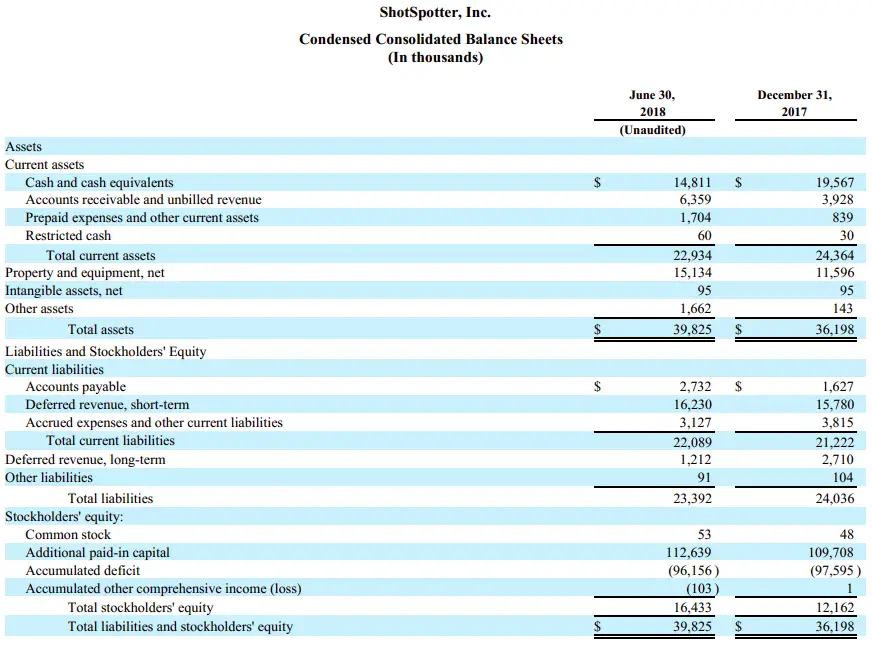
Below, we have the June 30, 2018 balance sheet from Etsy’s 10Q (quarterly report) obtained from their investor relations page of their website.
If it’s hard to read the small font below, then here’s the link to open it in your browser.
ASSETS
The assets at the top are the most liquid, meaning cash or tender that can turn into cash quickly. If you can turn these assets into cash in a matter of a few months or at the latest just under a year, then they are categorized under “Current Assets”.
As you go down the list of Assets, the items are less liquid, like property, plant and equipment. These items take a year or more to liquidate and turn into cash. They are categorized under “Long Term Assets.”
Cash and Cash Equivalents
Etsy had $357.8 million in cash at June 30, 2018. Cash equivalents are liquid investments such as stocks that can be sold and turned into cash in a matter of a few weeks.
Cash is the most critical component in the financial health of a company as cash allows the company’s operation to run as it pays for supplies and overhead expenses as well as act as a cushion for if they have a bad operational year.
Short-Term Investments (aka marketable securities)
Etsy had short-term investments of $209.7 million. Examples of short-term investments are commercial paper, Treasury bills (i.e. short-term bonds issued by the government), which can be liquidated into cash in less than a few months.
In order for the investments to be qualified as short-term investments on the balance sheet, there must be little to no risk of these investments defaulting.
Accounts Receivable
When a company sells their product or service, the company can give their customers time to pay. If the service has been rendered or the product has been sold but the company is still waiting to be paid, this amount goes into accounts receivable.
Depending on the company and the industry, payment terms can range from 30 to 90 days. Of course, the shorter the payment terms, the better, because again, cash is king.
An example of a longer payment term may be a consulting business. The consultant can provide the service first, and then invoice them after.
In the case of Etsy, accounts receivable is $30.6 million, which is very low relative to its sales.
Etsy is an example of low accounts receivable payment terms since most of their revenue comes from taking a cut when a transaction is made. They presumably receive the funds within a few days after the transaction is made between the platform’s sellers and buyers.
Inventory
Etsy doesn’t have any inventory because of the nature of their business. In other businesses that do have inventory, this can be made up of raw materials, work-in-progress to make the finished goods, and the finished goods that are sold.
Inventory turnover analysis (more below under balance sheet ratios) is very telling of the company’s working capital management.
Inventory is part of current assets, because it consists of products that are to be sold in less than a year.
Or another way to consider it is that one can theoretically liquidate all the inventory in less than a year if they had a fire sale.
Fixed Assets (aka Property, Plant and Equipment)
Fixed assets are long-term assets, because they support the operation of the business for longer than a year. The amount of fixed assets relative to the size of the company will vary based on the nature of the business.
For example, a manufacturing company will have high fixed assets due to plant, machinery and equipment, compared to an online marketplace platform like Etsy. Etsy’s fixed assets net of accumulated depreciation and amortization as of June 30, 2018 is $117.0 million.
Online companies’ fixed assets will mainly be composed of computers, office furniture, and their office buildings and property.
The fixed assets line on the balance sheet will indicate “net of depreciation”. How depreciation is calculated is another matter.
Goodwill and Intangible Assets
Goodwill arises when a company acquires another business for an amount higher than the sum of all their assets.
In this case, the difference is goodwill, which you can think of as the intangible value that the business that was acquired built over time being in operation.
Intangible assets include patents, trademarks, and copyrights. Etsy’s goodwill and intangible assets are $38.0 million a piece. Right off the bat, this should give us some indication of their business style.
For example, their growth strategy doesn’t shy away from acquiring other businesses. Or, they value intellectual property to create a defense for their business.
LIABILITIES
Similar to assets, liabilities are also organized into current and long-term. Current liabilities are what the company owes which must be paid off in a year. Long-term liabilities are what the company owes but don’t have to pay back for longer than a year.
Accounts Payable
Etsy’s accounts payable was just $14.8 million, which makes sense because Etsy is an online marketplace, so there are supplies or raw materials they would need to purchase to make products.
Any money owed to suppliers or vendors that you need to make or sell your products goes under accounts payable.
The vendor on the receiving end would put it in their books as accounts receivable.
Similar to accounts receivable, the payment terms are between 30 to 90 days, depending on the company and industry.
Accrued Expenses
Accrued expenses is the same concept as accounts payable, in that they are amounts owed by the company in the short-term.
But rather than to suppliers and vendors, these amounts are owed to employees and banks, for example, for what have been rendered, but not yet paid.
Deferred Revenue
Deferred revenue is interesting, because it’s not a straightforward concept as a service or product that has been rendered and you owe them for it.
Deferred revenue is when a customer receives the money for goods and services before the goods and services have been rendered.
So, rather than owing money, deferred revenue means a company owes products or services.
Other Current Liabilities
Anything else not mentioned above but are amounts owed by the company to others for something that has been accrued but not paid for yet go under here.
Current Portion of Long-Term Debt
Any debt from a lender, such as from the bank or for royalty financing, mortgage, or other types of money owed to a 3rd party that has a term of more than a year is long-term debt.
The amount of that debt that is owed within the next year falls under here, under current portion of long-term debt.
Long-Term Debt and Financing Obligations
Any portion of the long-term debt discussed previously that isn’t due for more than a year is summed up and put here.
STOCKHOLDERS’ EQUITY
This is by far the most un-understood part of the balance sheet by non-accountants.
Stockholders’ equity (or shareholders’ equity) is the sum of all the amounts invested into the company by the company’s owners. It’s an easy concept, but there are some nuances that make it tricky for some people. Let’s dive in.
Sometimes, common stock, preferred stock, and additional paid-in capital can all just be summed into online called equity capital or share capital.
Common Stock
Common stock is the shares in the company that the owners bought directly from the company.
For example, if a pair of co-founders started a private company with $100,000 each, this would show up here as $200,000.
For a public company, common stock could represent the amount issued to the public via an initial public offering.
But the tricky thing here to note is that the amount of common stock on the balance sheet does not equal the market value of the shares.
For example, say the owners fixed a common stock value of $0.01 per share and issued 1 million shares. The total common stock value is then $10,000. But when the shares went public, the stock may have been very popular and investors were willing to pay $1 per share, driving the value of the 1 million shares to $1 million. The common stock line would still be $10,000.
The difference between $1 million and the $10,000, i.e. $990,000 would appear under the Additional Paid-in Capital line.
Preferred Stock
This has the same concept as common stock, but preferred stock is less risky, because the owners of preferred stock have more protection for their shares. For example, they have voting rights. And they might get dividends.
Retained Earnings (or Accumulated Deficit if negative)
A company’s owners has the right to take out all the profit earned by the company. If the owners deem that the company needs the profit to be reinvested back into the company, then this amount is called retained earnings, net of any cash dividends paid to the owners.
One thing to note here is that retained earnings is a cumulative amount of all the profits reinvested back into the company by the owners.
Retained earnings is a funny concept, because the purpose of it is to make the balance sheet balance when, let’s say, a company buys equipment using the profit.
When they increase the fixed assets line at the time of purchasing equipment, they need to show where that money came from. Because it came from profit which would have been paid out to the owners, it shows up under stockholders’ equity. But, that’s really all that is.
When you sell a company, the retained earnings doesn’t equate to cash. It kind of, well, goes away for the owners selling the business.
So, why would owners want to reinvest their profit back into the business and increase retained earnings?
Well, if the company is in financial trouble and need the money to stay afloat, that’s one reason.
Another reason could be to keep growing the company to increase the market value of the assets and the company’s profits. That way, the owners can sell the company at a much higher valuation.
When the profits are negative and therefore, the retained earnings will be negative or otherwise called accumulated deficit.
Losses are common for startups, so accumulated deficit is common but if the company has been around for a long time, and the accumulated deficit keeps building, then this could be a signal that the company is in financial trouble.
How to Analyze a Balance Sheet
Now, let’s get to the fun part!
Here’s the thing. You can spend hours analyzing a balance sheet and the rest of the financial statement, but you might not conclude on an interpretation of how the company is doing.
There are many formulas and ratios you can calculate, but it’s a waste of time to plug numbers into all of these and stare at them without putting them into context.
On the other hand, you could pick out a few things and then make an unfair judgement on how you think the company is doing.
Finding the right balance of knowing which key numbers to analyze while not poring over them for hours on end is the technique we will focus on.
First, get in the habit of asking “why?” when you look at a number so we can try to uncover the underlying reason for the company’s performance.
Next, understand the purpose of why you’re calculating the balance sheet ratios for the analysis. I like to look at the purposes of the balance sheet analysis to analyze the following:
- Liquidity (Includes Working Capital Management and Leverage)
- Operating Performance
- Management Strategy
Profitability will be discussed after the chapter on Income Statement.
Okay, let’s dive deeper into each one.
Balance Sheet Analysis: Liquidity
The number one weakness I observed in the many companies I invested in during my career was lack of liquidity analysis on their part.
Companies that didn’t know how much cash they were going to get next month, 6 months later, a year from now, etc often ran into financial trouble.
We will focus greatly on liquidity forecasting in a later chapter when we’re putting it all together. But for now, we can also get a pretty good snapshot of a company’s liquidity position based on balance sheet numbers, which we will do here.
I’m going to lump working capital management in this category as well as leverage, because these ratios all point to the same thing at the end of the day – how much cash does the company have or will have?
Again, I’m not going to go through a list of ratio after ratio. That’s overkill. The technique is to focus on the key numbers to analyse (I’m appealing to all my English-dialect audience here, interchanging between “analyze” and “analyse”.)
1. Cash is 0 while Debt is Growing
This is a red flag. Your company may have issued debt to pay for start-up costs, for machinery to expand the business, to pay off another debt, which is fine. But if debt is growing while there is no cash cushion, then you’re relying purely on a growing level of profit to sustain the business.
If debt is growing while cash is dwindling down to 0 or is at 0, this signals that you need to take a closer look at your margins and your operating expenses, i.e. overhead. If gross margin and profit margin are thin, you’ll perpetuate the debt problem.
We’ll discuss in later parts how to skim down your costs to improve margins.
For Etsy, although debt is quite high, cash exceeds debt.
Cash is $357.8 million while debt by way of facility obligation and long-term debt are $60.0 million and $269.1 million, respectively, for a total of $329.1 million.
So, for instance if the company does horribly next year, doesn’t meet debt covenants and the facility holder calls the obligation, the company has cushion to pay for it rather then have to turn all their collateral assets over to them.
2. Current Ratio
Current ratio measures how much liquid assets your company has in relation to the total amount that is due in the short-term.
The ratio is calculated as:
current assets / current liabilities
Breaking that down further:
[cash + marketable securities + accounts receivable + inventory + other current assets]
/
[accounts payable + short-term debt + accrued liabilities + other current liabilities]
The resulting ratio basically measures whether your company can go belly up because of an inability to pay for all the money due and payable to the suppliers and the bank.
If the ratio is below 1.0, then this is a signal that the company may have liquidity problems. The ratio above 1.0 doesn’t mean the company is safe and sound though, because the company might be inventory heavy.
And if they have poor inventory turnover and they’re not able to collect cash from accounts receivable, then the company can’t turn the current assets around quickly into cash.
There’s a solution to this issue so we can better analyze the ability to turn current assets into cash to cover all the current liabilities; that is, the quick ratio.
3. Quick Ratio
Quick ratio alleviates some of the problems arising from poor working capital management contributing to the lack of usefulness that the current ratio can tell us.
The ratio is calculated simply as the current ratio minus the inventory in the numerator:
current assets – inventory
/
current liabilities
That is,
[cash + marketable securities + accounts receivable + other current assets]
/
[accounts payable + short-term debt + accrued liabilities + other current liabilities]
The resulting ratio measures the ability for your company to pay for the short-term obligations with the cash or very liquid items that can turn into cash quickly. It takes away the uncertainty of inventory liquidating into cash.
Similar to the current ratio, if the quick ratio is above 1.0, then the company’s liquidity is not a huge concern. Since we took away an item in the numerator, we would expect the quick ratio to be lower than the current ratio. To address that effect, if the quick ratio is between 0.8 and 1.0, then it’s acceptable. If below 0.8, then it’s a signal that you need to look at each item in the current assets and current liabilties and address whether there can be improvements.
4. Managing Accounts Receivable (A/R)
Accounts receivable concerns liquidity, because it’s how much will turn into cash. A/R is a part of working capital and poor working capital management results in liquidity problems.
Accounts receivable is used to incentivize customers to buy now and pay later. But problems arise when a company doesn’t have a good process of collecting the cash when A/R becomes due.
A broken process of A/R collection could include:
- Complicated method for customers to pay
- Invoices not being sent on time to customers
- No follow up to the customer to collect the payment
- Not doing a proper credit check on customers and inevitably not being able to collect the payment from the customer
To gauge whether your company has the risk of bad A/R management which could turn into a bigger liquidity problem, track whether A/R has been increasing while sales has not.
If sales is at the same level or declining but A/R continues to grow, then you need to look further into the A/R function.
Further, group individual accounts receivables into categories of # of days outstanding.
For example, say your accounts receivables are grouped as follows:
- 0 – 15 days outstanding: $350,000, from 24 customers
- 15 – 30 days outstanding: $200,000, from 17 customers
- 30 – 45 days outstanding: $135,000, from 9 customers
- 45 – 60 days outstanding: $80,000, from 7 customers
- 60+ days outstanding: $55,000, from 3 customers
if your payment term with your customers is 30 days, customers whose accounts receivables are outstanding beyond 30 days have a lower probability of paying.
Have all the customers been contacted about the payments outstanding? Do you have a designated bookkeeper/collections manager reaching out to customers and working out when the payments will be collected?
Bad debts is amount of accounts receivable that will never be collected. There are a few of different ways to predict bad debt based on your historical figures. The most common way is to take your historical amount of accounts receivables never collected divided by total sales that were sold on credit for the year.
It’s optional but tracking days of sales outstanding is also another way to measure A/R management. This is calculated in 2 steps:
- Annual Revenue / 365 = Avg revenue per day. Then,
- A/R / Avg revenue per day = days’ sales outstanding
For a company like a manufacturer of commercial cleaning appliances, most likely all their sales will be on credit. That is, they will make the sale, deliver the product, and then invoice the customer. In this case, bad debt is a % of historical amount of A/R never collected divided by total sales for the year, without making a distinction to sales being on credit.
Since every type of business will have different A/R payment terms and % of bad debts, I don’t want to generalize what is a good or bad bad debt amount. But as a very general rule of thumb, if bad debt % of total sales for the year is above 5%, then this is a red flag.
And, if the bad debts % has been increasing over the years, then you have to look closely at whether your A/R collection function is working or needs improvement.
5. Managing Short-Term Debt
Debt is like a blowfish. If you take good care of it, it enriches your business and there are many benefits you can leverage from it. But if you let it get out of hand, it can kill your business.
Some people are completely turned off by debt and as a result, they are perpetually strapped for cash and limit their business from growing all in an effort to have $0 debt on their balance sheet.
As I mentioned, as long as you maintain good practices around debt, it can help your business grow.
Short-term debt is more dangerous than long-term debt though, and needs more attention. If you’re relying on your business’s profitability to pay off the short-term debt and you don’t meet your profit target, then your lender can call an event of default.
So, what are signs that short-term debt is getting out of hand and is at risk of dragging your business down?
- If short-term debt keeps growing and inventory and A/R grows even faster. This signals that the company is using short-term debt to pay for inventory and whatever cash is required for working capital.
- If there is hardly any cash left, and line of credit is maxed out and there is also short-term debt outstanding. This becomes a problem if the company doesn’t have enough cash flow. Major red flag that there is no cash cushion to pay for the debt interest and/or principal when it’s due.
If the above applies to your company, debt needs to be managed before growing your business. We will discuss debt management best practices later on in the series.
6. Long-Term Debt to Equity Ratio (D/E Ratio)
An easy snapshot of whether there is too much debt in the company is to calculate the debt to equity ratio. In a D/E ratio, you only account for long-term debt, because long-term debt is what can have an insidious effect on your company.
D/E ratio is calculated as long-term debt divided by stockholders’ equity on the balance sheet.
As a general rule of thumb, if D/E ratio is more than 0.6, the company is borderline at risk. For some companies that require expensive machinery and equipment like manufacturing companies, D/E ratio above 0.5 is considered risky.
When your company’s D/E ratio is above 0.6, then you need to look at your debt management carefully. Again, to be discussed later in the series.
Balance Sheet Analysis: Operating Performance
Moving on to the next set of balance sheet analyses, we’ll now look at the company’s operating performance.
These analyses help you understand whether the day-to-day operations of your business is sound. Day-to-day operations include your relationship with your suppliers, customers, product management, etc.
Picking up from where we left, we’ll continue with #7 for the list of analyses.
7. Accounts Payable & Cash Both Growing
Accounts payable is a part of working capital management, but more importantly, this concerns supplier relationships. The company may be saving up cash for other things at the expense of A/P.
If A/P is not paid on time or the total keeps growing, the company can damage relationships with suppliers. There are benefits to having good relationships with suppliers, such as negotiating for better prices.
This could have a major advantageous impact on your margins when you’re producing at scale, so you don’t want to risk your relationship with your suppliers.
8. Inventory Forecasting
Inventory levels tell you a lot about whether a company has their sh#% together in terms of an operating process that works.
If inventory is growing at a faster rate than sales and the business is not a typically seasonal business, then the company may have poor sales forecasting.
Another way to gauge whether a company has good sales forecasting and a high inventory turnover is to calculate the inventory turnover.
Inventory turnover is calculated as cost of goods sold (income statement item) divided by average inventory (which is beginning of period inventory plus end of period inventory divided by 2).
6x of inventory turnover equates to 2 months’ inventory on hand. 12x of inventory turnover equates to 1 month of inventory on hand on average.
Then, compare your company’s inventory turnover to the industry average.
9. Cash and Marketable Securities is Growing, All Else Constant
Earlier, we saw the dangers of growing cash while A/R and A/P grow. But if other items in the balance sheet stay constant and only cash and marketable securities continue to grow, then this is a good sign. Finally, some good news!
It means the company doesn’t have an immediate need for cash. Yes!
10. Convertible Debt & Preferred Stock Signals Risky Business
If your company had convertible debt and preferred stock from the beginning to launch your business, then it’s acceptable.
But if a company recently issued convertible debt that does not have a competitive interest rate or recently issued preferred stock, then this is a signal to improve your business’s profitability and margins before anything else.
Let’s look at why for each.
Convertible debt is when you borrow money at a really low interest rate. Why would the convertible debt holders want to do such a thing? The debt holders may be getting lower interest rate, but they have the incentive to turn the debt into equity when a company does well.
So, the company is giving away upside of the company’s growth by getting a bargain on low interest rate today.
But, if the company recently issued a convertible debt at a high interest rate, that means 2 things: the company has exhausted all sources of funding and have no choice but to give away their company in times of upside just to get debt now or that the lenders see the business as risky.
If this is happening to your company, you need to consider whether you’ve exhausted ALL sources of funding, because convertible debt is not attractive.
Now, on to preferred stock.
Preferred stock is always thought of as funding of last resort, because the company has to pay out dividends AND give away equity of the company.
In addition, the dividends the company has to pay to preferred stockholders are not tax-deductible for the company.
Why does the company have preferred stock? Similar to convertible debt, it could be because the company exhausted other sources of funding or lenders see the company as risky so they want more than just traditional interest.
We’re almost at the end. Stay with me.
Balance Sheet Analysis: Management Strategy
The next set of analyses helps you understand whether your strategy conforms with good practice for growing a business.
Continuing on with the numbered analysis from the above section, next is #11.
11. Cash is Growing, All Else Constant
We’ve seen this a number of times above, where cash is growing at the expense of other accounts. We also saw this in #9, where cash is growing, which means the company is doing well.
If you take it one step further, what this could also be signaling is a strategy to expand.
You might be saving up the cash to purchase a big ticket item like new equipment for expansion or perhaps you’re talking to a competitor about acquiring them.
In these instances where you’re letting cash grow in the account in order to execute on a growth strategy, then it’s good practice.
However, if you’re letting cash grow when there is no other strategy, then you’re letting the company drag cash.
Are there other accounts that can benefit from the cash? Can you use the cash to reduce debt? Can you invest in marketable securities that you can gain interest income from? Is A/P paid under the payment terms?
12. Profit is Going Into Retained Earnings
It is a perfectly good strategy to reinvest profits back into the company. When the company has positive earnings and this is reinvested, then this amount goes into retained earnings on the balance sheet.
This signals that management has faith in the company’s growth. Rather than just staying afloat or stagnant by taking the profit out of the business for themselves, management is putting it back in the company to position it to grow.
But make sure that you’re paying off your suppliers and debtholders.
I hope you’re beginning to see that all the financial statements analyses are interconnected and that continuous proper financial analysis is crucial in improving the business.
13. How Much Fixed Assets is Too Much?
Whether your company has the “right” level of fixed assets is dependent on the type of business and the stage of your business. But it is worth noting some questions to ask yourself.
There are 2 analyses that I’d like to introduce to you here.
The first is Return on Fixed Assets and the second is Asset Utilization.
First, Return on Fixed Assets.
In the next part on Income Statement Analysis, we will look at Return on Assets, but I’d like to mention a variation of a Return on Assets here.
Instead of calculating return on all assets, here, calculate the return on fixed assets. That is, Net Income (on the Income Statement) divided by Fixed Assets net of depreciation.
Over time, if the return on fixed assets has been decreasing while sales has been stagnant or declining, then this might signal that your company has invested too much into fixed assets.
Second, Asset Utilization.
One company that I analyzed and invested in with our fund had unnecessary fixed assets in their plants.
The company had 3 plants and 2 large machinery/equipment at each plant. Each plant was only being utilized 40% – 50%. And, they had employees spending too much time maintaining assets that weren’t being utilized.
Eventually, they consolidated two plants and sold the equipment at the plant that they shut down. This improved their margins significantly.
14. Changes to Common Stock
(We’re currently 5200 words and counting; kudos to you for making it this far.)
Finally, we arrive at analyzing common stock in the stockholders’ equity section of the balance sheet.
If you believe that your company is positioned to grow, or you want to clean up the balance sheet to sell your business, then it’s good practice to buy back the shares of your company from other equity holders.
If your company has employee stock option plan or you raise money because you need to pay off debt or you want some muscle to grow your business, then it’s acceptable for common stock to grow.
However, note that common stock growing doesn’t tell us much about the company’s performance. So, there’s more to analyze here if common equity is increasing.
Summary
We looked at 14 different steps to analyze a balance sheet. Each of them tells us a great deal about a part of the company’s liquidity, operating performance, or management’s strategy.
But, they must all be analyzed in conjunction with income statement analysis and the cash flow statement analysis in order to have a good understanding of the company’s big picture performance.
Having said that, congratulations for making it this far, but it’s not over yet. Let’s go on to the next part of financial statement analysis – Income Statement Analysis.