
[This is a part of a series on performing financial analysis of a company. If you want to skip ahead to more advanced level of the series, then check out the other parts.]
Knowing how to analyze financial statements of a company will take your business to the next level. Or you’ll become a superstar employee.
Going through a thick stack of financial statements can be daunting. And so many people spend time on useless parts of the financial statements and get lost in the words and numbers.
But a small private business or a large public company both have the same skeleton of financial statements. And so, when you know the technique to analyze financial statements, repeated practice will make you a pro at gauging when a company is in trouble or financially healthy.
Take a step back and equip yourself with the right tools to better measure the profitability and performance of any company.
In this post, we’re going to take a step back and dissect the parts of a financial statement before we dive deeper into analyzing financial statements in the next posts.
What you’ll find in this post (feel free to jump ahead by clicking on a section below):
- Financial Statement Numbers – Where Are They From?
- How are Financial Statements Organized?
- Balance Sheet
- Income Statement
- Statement of Cash Flows
- Notes to the Financial Statement
- Why Financial Analysis is Critical
- How to Analyze Financial Statements of a Company using Financial Analysis
Financial Statement Numbers – Where Are They From?
Financial statements are produced from bookkeeping of financial transactions. So, the process goes like this at the simple core.
You save all the receipts for cash outflow transactions. You save all the invoices and track the payments received from your customers for the cash inflow transactions. Any other financial transactions, you track as well, including salaries paid to your employees.
Then, a bookkeeper (or you) enters all of these transactions into the general ledger. When the bookkeeper enters the transactions into the accounting software, they categorize what account the transaction is for. For example, “Sales” or “Insurance” or “Cost of Goods Sold” or “Travel”.
When you organize the transactions you entered by account, then you’re looking at a “chart of accounts”.
At the end of the month, quarter, or year, you pull together all of these accounts and organize the accounts into different sections of the financial statement.
You explain some items in the Notes of the financial statement. You also explain the business, the risks, and what contributed to certain increases and decreases in the company’s performance.
Finally, you get the financial statements reviewed or audited by a CPA for credibility and accuracy.
How are Financial Statements Organized?
There are 3 core sections of a financial statement:
- Balance Sheet
- Income Statement
- Statement of Cash Flows
- And the 4th important part of the financial statements is the Notes section.
There are also a ton of other information you can find in financial statements, including financial controls, explanation of the nature of the business (which is helpful for analysts), and risk factors of the business and the industry.
Financial statements can be pulled together on a quarterly basis and on an annual basis. In Australia, companies are also required to put together half-year accounts, which was actually really helpful when I analyzed Australian mining companies back in the day.
You need all 3 sections of the financial statements and the Notes to get a sensible understanding of the company’s performance.
And the right techniques of the financial analysis will help you step back and get a bigger picture of how the company can improve using budgeting, forecasting, and financial planning & analysis.
Let’s get into a little more about each section to put everything into context. I’m going to use an example company to illustrate the function of each section. The example company is ShotSpotter Inc, which provides technology to locate gunfire and send officers to the location. It is a public company listed on NASDAQ.
Balance Sheet
A balance sheet looks at the company’s assets and liabilities position on a particular date the balance sheet was produced.
For example, in ShotSpotter’s balance sheet below, the company reports 2 dates – June 30, 2018 and December 31, 2017.
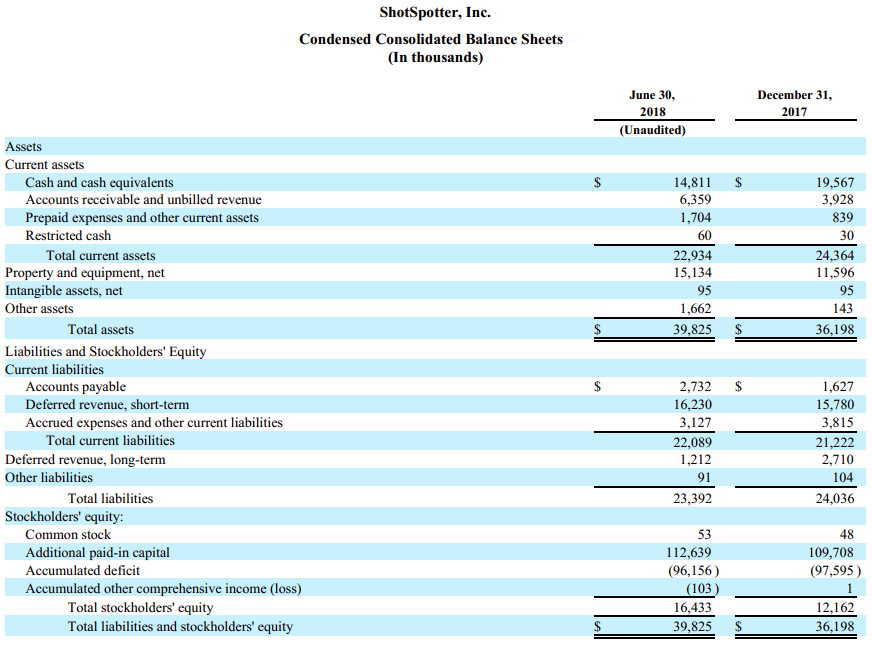
On December 31, 2017, the company had $19.6 million of cash in the bank. Then 6 months later on June 30, 2018, the company had $14.8 million of cash in the bank. The decrease means they used up the cash over the 6 months. It could’ve been for supplies, salaries, new assets, or paying off debt. This is when the Notes section comes in handy.
Similarly, on December 31, 2017, the company’s property and equipment assets were worth $11.6 million. Then 6 months later on June 30, 2018, the company’s property and equipment assets were worth $15.1 million. The increase means that the company acquired more property and equipment over the 6 months.
Let’s just look briefly at each part that composes the balance sheet.
We’ll discuss the details of the Balance Sheet items and the corresponding financial analysis ratios in the next post on Balance Sheet financial analysis.
Income Statement
Whereas a balance sheet shows you a snapshot of a company’s financial health on a given date, the income statement shows how the company performed over a period of time.
The income statement, which is also called a profit and loss statement or a statement of operations, basically shows revenues minus all the costs and expenses to get to profit.
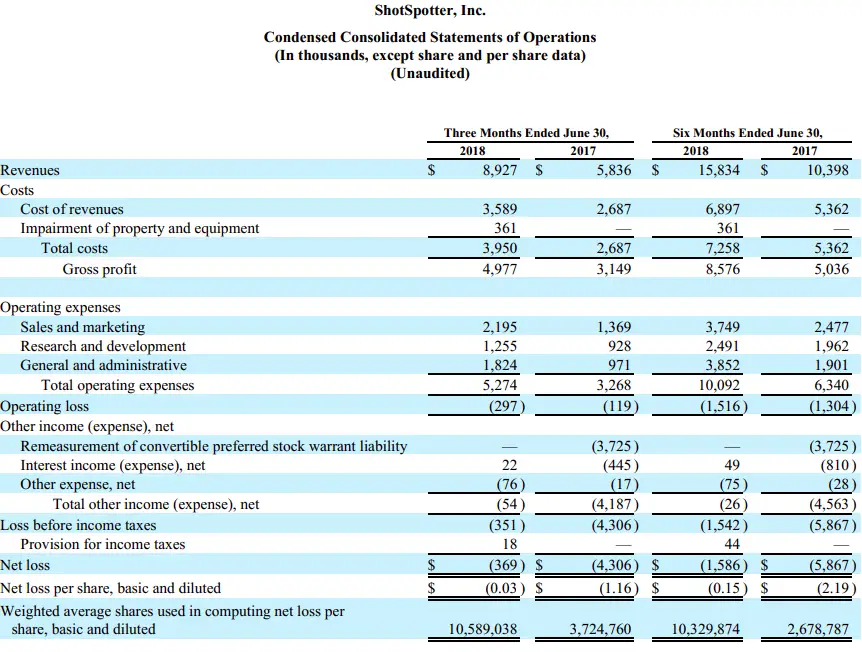
In ShotSpotter’s income statement above, the company’s 6 month performance from January 1, 2017 to June 30, 2017 was $10.4 million. Their 6 month performance from January 1, 2018 to June 30, 2018 was $15.8 million.
Every income statement starts with the revenues (i.e. sales). Then, the costs associated with the goods sold. For instance, cost of the materials to make the products.
Then, the operating expenses which are overhead costs. Next comes any other expenses other than cost of goods sold and overhead, such as debt interest.
At the end, you end up with profit or loss.
Merely looking at the income statement is not a good enough measure of a company’s financial health. You have to analyze the income statement in conjunction with the balance sheet and the statement of cash flows.
More details on the income statement items and financial analysis in the next post on Income Statement Financial Analysis.
Statement of Cash Flows
Statement of Cash Flows or Cash Flow Statement focuses on the actual cash coming in and going out of the company. It shows where the cash in the company’s bank came from and where it was paid out to.
And at the end, it shows how much cash they began the period with and how much cash they have in the bank at the end of the period.
Moreover, the cash flow statement is broken down into 3 sections:
- Cash flow from operating activities
- Cash flow from investing activities
- Cash flow from financing activities
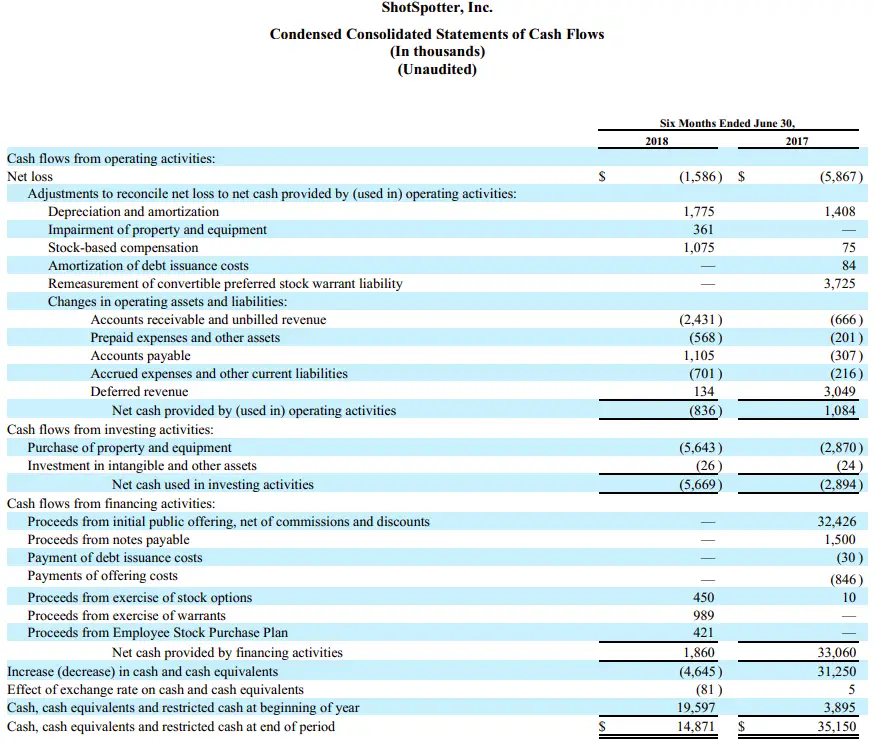
In the Statement of Cash Flows of ShotSpotter above, the company brought in cash flow of $1.084 million between January 1, 2017 to June 30, 2017 from activities to do with operations. In the six months between January 1, 2018 to June 30, 2018, the company had a net cash outflow of $0.836 million due to operating activities.
In the 6 months from January 1, 2018 to June 30, 2018, the company purchased $5.643 million of property and equipment.
In the first half of 2017, the company raised money in the public markets and thus had $32.426 million cash inflow. Comparatively, in the first half of 2018, the company did not raise any money through public financing.
Overall, on January 1, 2018 (beginning of the year), the company had cash of $19.597 million in the bank. At the end of the 6 month period, on June 30, 2018, the company had $14.871 million due to cash inflow and outflow from operating, investing, and financing activities.
The statement of cash flows is an incredibly useful measure in budgeting and forecasting especially if there are multiple product lines, segments, and functions within the organization.
My goal of this online “book” (blog?) is to help non-finance business people to take their business to the next level with proper techniques to budget and forecast. So, we’ll spend significant time in the Statement of Cash Flows post and you’ll see how that flows into the liquidity analysis and forecasting.
Notes to the Financial Statement
70% of the financial statement is made up of notes explaining the assumptions behind the numbers in the consolidated financial statements. So this section is very important.
The Notes starts with whether the financial statement was prepared on the basis of cash or accrual. Other common notes include what method of the depreciation was used.
If the company has different product lines, the notes will also break down revenues by product line or region.
When you notice items in the financial statements that are out of the ordinary such as discontinued operations, then scroll down to the Notes pertaining to that item, and you’ll most likely find an explanation.
We’ll look at the Notes in each detailed post about the Balance Sheet, Income Statement, and Cash Flow Statements analyses.
Why Financial Analysis is Critical
During my decade of working with companies that my team invested in, it was clear which companies performed well and which companies kept running into problems.
The companies that had a proper budgeting and forecasting as well as financial analysis process were able to mitigate disaster in the recessionary periods.
The problem companies, however, are often on the verge of complete disaster scenarios, because they don’t have a robust financial planning and analysis process.
This is what happened with one company we invested in which became a huge headache:
- The owner/operators of the company was a couple in their late 50s. They had started their company 15 years ago. They were excellent in the operation of the company, and they made decision to multiply their product lines 3 years ago.
- Their revenue jumped from ~$1 million 5 years ago to about ~$8 million this year. AMAZING, right? But guess what. They weren’t even close to being profitable. They had losses of ~$2 million this year.
- When they had one product line, they had a handful of customers and suppliers, so they were able to track how much was coming in and leaving the company. But with the growth of the product lines, they had no way of predicting how much cash they needed and how much cash they would have. And their overhead was off the charts.
- So, you can guess why. They only had a bookkeeping software they relied on. They did attempt to have a budget, but they were just a bunch of numbers pulled from the accounting software without any meaning.
- Without a proper budgeting and forecasting process, they couldn’t identify where the cash drain was in order to improve their business performance.
- They couldn’t forecast when their customers were going to pay them and when their suppliers were expecting them to pay. So every month, they found themselves negotiating with their lender and suppliers to delay payment with penalty because they always had $0 in the bank account. Their liabilities grew because of penalties, and they were caught in a downward spiral.
I don’t blame these owner/operators. They were fantastic at operating the company, and kudos to them for growing the company from nothing to $8 million in sales. They had a bookkeeper and and a part-time accountant.
But before growing the company, what they really needed was to create a budget and a forecasting model using financial analysis of their historical operating numbers. This is all a part of Financial Planning & Analysis, and it is absolutely fundamental if you want the business to succeed in the long term.
How to Analyze Financial Statements of a Company using Financial Analysis
Here, I want to spend a little bit of time going through what financial statement analysis involves and how it ties in with budgeting and forecasting.
When you’re comfortable navigating sections of the financial statements, the next step in the financial statement analysis is to calculate key financial ratios.
There are financial ratios using Balance Sheet numbers only which often measure working capital management, operation performance such as inventory management and liquidity.
Ratios using Income Statements numbers are mostly used to measure profitability.
And, ratios using the Cash Flow Statement numbers measure if you’re using the cash efficiently.
Then finally, you can combine numbers from the Balance Sheet, Income Statement, and the Cash Flow Statements, as well as other data such as number of employees.
All of these ratios will allow you to measure the performance of the business in various angles so you can identify where your business is outedging the competition, where the business needs to improve, and then very importantly, you can then budget and forecast your target ratios for everyone in your business to meet periodically.
Summary Recap
In my experience working for a fund and investing in private companies, I have seen way too many companies with good people and a good business model fail due to lack of financial planning.
Financial planning and analysis involves understanding your numbers, and then interpreting the numbers to how the business is performing.
As this post illustrated in big picture, the steps to get from using raw data to taking your business to the next level are:
- Know how to navigate the financial statements, and use the chart of accounts in the accounting software as raw data.
- Pick out the key numbers in each section to calculate ratios and interpret rather than wasting your time poring over financial statements for hours and hours. The next posts will discuss in detail for each section of the financial statements which key numbers to look at.
- Pick out the key numbers you need, and calculate key financial and performance ratios.
- Use the ratios to identify areas of improvement.
- Create a budget for each function of the business to follow.
- Model out a monthly forecast and a 5-year forecast with target numbers to hit. The model also shows how much cash you will have and how much cash you will need.
Continue reading the series to master the key financial analysis techniques and budgeting and forecasting tools and apply them to your job or your business for success. Next, Part 2: How to Analyze a Balance Sheet. Or, skip ahead to Part 3: How to Analyze Common Size Income Statement.
i wish i could have a lessom in deep with you so that i can be more panctual in financial
That is very nice of you to say, thank you Monica! I am working on an online course now. Hopefully you’ve signed up on the right side so you can get the notification when the course is available! Thanks for reading 🙂
I am intersted in your course. Let me know the dates
Thank you
Thank you
Thank you, Luis!
Thank you, Luis! I don’t have any courses yet, but I can put you on the mailing list so that when I do have courses in the future, then you can be notified. Thank you!