
[This is a part of a series on performing financial analysis of a company. If you want to skip ahead to more advanced level of the series, then click here.]
An income statement is the section of the financial statements that everyone flocks to, because it’s easy to tell if the company is making money.
But looking at an income statement as is doesn’t tell you much. You have to set it up as common size, analyze the ratios, and interpret what they tell you about the company’s performance.
So, the goal of this post will be to show you how to set up an income statement into a digestible format that you can analyze.
Then, I will take you through the techniques to interpret the analysis of a common size income statement using an example to illustrate the points.
Remember not to get too bogged down in the details too much. We always want to take a step back and get a big picture of the company’s performance in order to make decisions about its future strategic direction.
Lezz go!
Table of Contents
Here’s how this post is set up; feel free to jump ahead or read from top to bottom to gain a solid understanding of using an income statement to your advantage.
- How to Set Up Common Size Income Statement
- How to Analyze Common Size Income Statement
- Common Size Income Statement Analysis Example
- How to Analyze Income Statements With Ratios
- Summary
How to Set Up Common Size Income Statement
First, looking at an income statement tells you how much the company made in the period, but it doesn’t really measure the company’s performance over time or where the source of the performance is from.
To analyze an income statement (aka profit and loss statement) so that you can make decisions based on the performance measures, we should be looking at the income statement as common size.
What is common size? Common size simply is when you take each line on the income statement and divide it by the revenue in the same period.
For example, here’s the 3 months ended 2018 and 2017 income statement of ShotSpotter.
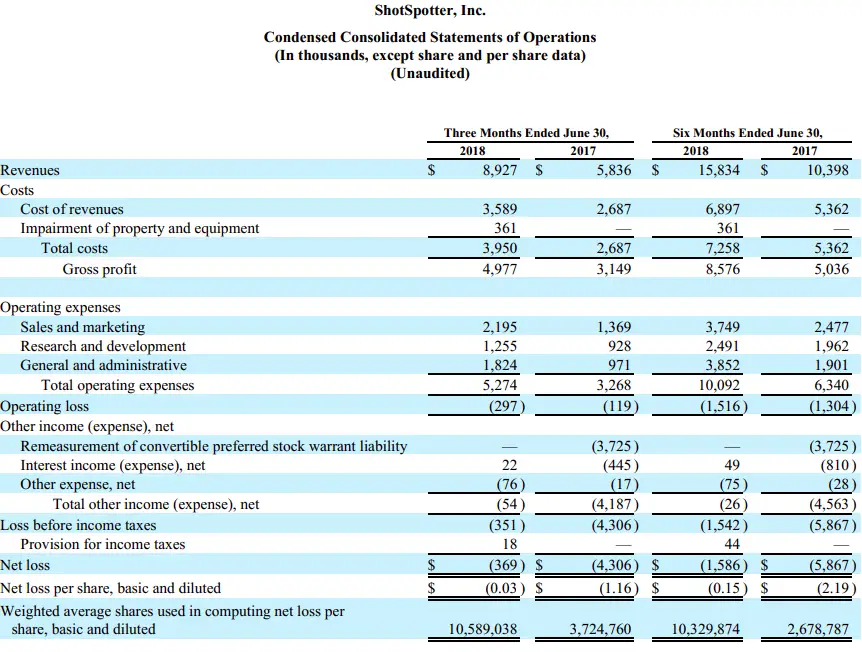
Now, let’s look at a few items in common size:
- Revenue for the 3 months ended June 30, 2018 is calculated as 8,927/8,927 = 100%.
- Total costs of 3,950 is divided by 8,927 to get 44%.
- Gross profit is calculated as 4,977/8,927 =56%, and so on.
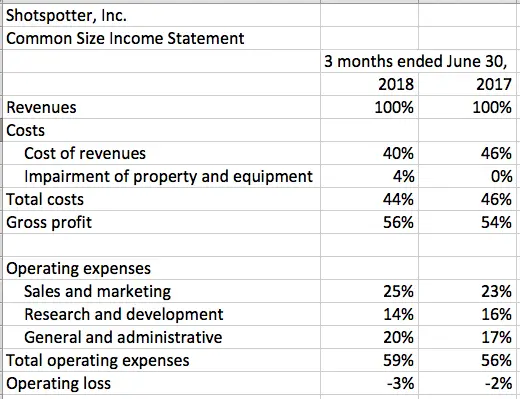
So, when you turn an income statement into common size, it should look something like this:
Looking at the income statement as common size allows you to compare each item over the period on an apples-to-apples basis. That is, as the company grows, other items should be increasing proportionally.
You can use common size to break down the source of what’s making the company grow or shrink.
Ideally, you should have 5 year historical income statements. Quarterly would be useful if the business is seasonal or cyclical, so you can compare the same quarter year over year.
Now that you’ve set up the income statement, let’s analyze and interpret the numbers.
How to Analyze Common Size Income Statement
As you can see in ShotSpotter’s quarterly common size income statement above, can see on one page a snapshot of gross profit margin and operating margin.
Another purpose of analyzing an income statement is to identify which aspect of the business is thriving or struggling.
To analyze an income statement to measure the company’s performance,
Step 1: Set Up
First, as discussed, set up the common size for the last 5 years.
Step 2: Margins
Compare the margins over the period and see if there is a trend or an unusual spike or dip. Ideally, we would hope to see a stable and gradual growth. The comparison of the margins over the period should indicate the performance of the company. The margins you should have are:
- Gross profit margin
- EBITDA margin
- EBIT margin or operating margin
- Net profit margin
Step 3: Analyze Each Line
Now, dig deeper into why the company’s margins increased, decreased or remained consistent by looking at the items above the margins.
Go through line by line from top to bottom, spending more time on the bigger numbers as they would have contributed to the margins more significantly.
Identify the items that contributed to a deterioration in margins or an increase in margins.
For example, above in ShotSpotter’s quarterly common size, Research and development expense jumped from $928,000 to $1,255,000, and you may immediately jump to the conclusion that the company is spending too much on R&D. But when you look at the common size, R&D as a percent of revenue went down from 16% to 14% over the period. One would expect costs and R&D investment to increase as revenue increases, so it’s not a surprise.
Step 4: Dig Through Notes
Look at the Notes section of the financial statements (if you’re investigating a company that’s not your own) or ask your team’s functional head for a further breakdown of the line item if it’s available.
If you’re a one-man show, you can gain more knowledge by printing out a Chart of Accounts from your accounting software. You can read more about this in Part 1 if you haven’t already.
Also, look at the Notes section (or function lead) for an explanation on why the particular item increased or decreased that period. Is this a trend that’s been occuring every year or a one-time thing?
Step 5: Put It All Together
After you’ve gone through this process, it’s time to put all your findings together.
After identifying which line items contributed to the growth or decline, you’ll likely see a common theme. And, this will give you a clearer big picture of what’s working well for the company and what areas of the business should improve.
If this seems complicating, I assure you that it’s not. It’s a bit of work to dig for information but well worth your time, because this will help you understand your business’s performance.
And, once you set up the common size, you can just add the next year’s data and so on. Everything up to the current period will have been analyzed, so you can carry on with the “storyline” of the business.
Now, let’s go through an example together.
Common Size Income Statement Analysis Example
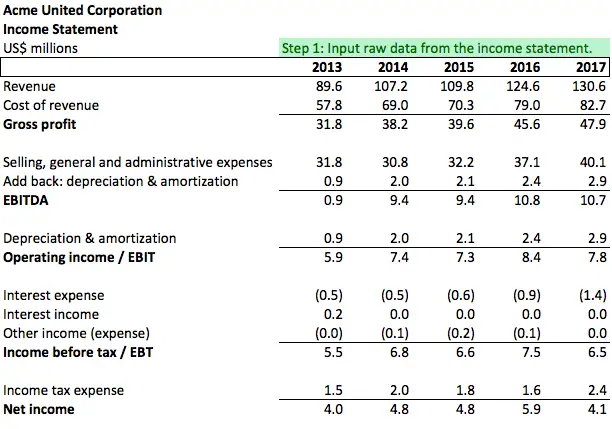
For this example, we’re going to look at Acme United Corporation. Acme United has been around for 150 years and they are a “leading worldwide supplier of innovative cutting, measuring, first aid and sharpening products to the school home, office, hardware, sporting goods and industrial markets.
The following is how to use the steps from above in the analysis.
Step 1: Set Up (Analysis Example)
I went ahead and pulled the annual reports for the last 5 years and converted their income statement into common size.
Step 2: Margins (Analysis Example)
After converting the income statement to common size, I included all the margins – gross profit, EBITDA, EBIT, EBT, and net profit margin, as follows.
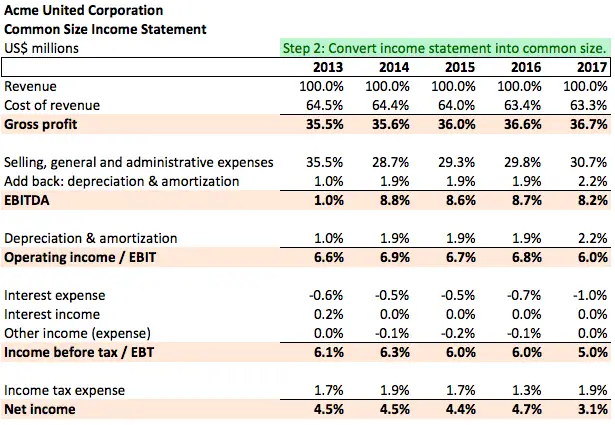
Immediately, we see that the gross profit margin has been increasing over the last 5 years. Net profit margin, on the other hand, has been declining.
What are the reasons for these opposing trends? Are they investing heavily in capital assets? Are their fixed costs too high?
In Step 3, we go through line by line to answer these questions.
Step 3: Analyze Each Line (Analysis Example)
Going from top to bottom, let’s start analyzing line by line and make notes.
- Revenue – Revenue has grown over the last 5 years, so the business is expanding. This could be due to higher unit price, or more units sold, or both. This is from the income statement not the common size.
- Cost of revenue – Cost of revenue as a percentage of revenue has gone down from 64.5% in 2013 to 63.3% in 2017. This is great news. They have managed to shave off the variable cost little by little over the last 5 years.
- Gross profit – So, we know that gross profit increased because the company focused on cutting down the variable cost, i.e. the cost of revenue.
- Selling, general and administrative expenses (“SG&A”, operating expense, overhead) – Since SG&A is a relatively fixed cost, the company would benefit with a higher profit as the business scales. Typically, unless the company expands astronomically, we should see a gradual decrease in SG&A as a percentage of revenue as revenue grows. For example, let’s say revenue is $100 and SG&A, i.e. office overhead, is $30. That’s 30% SG&A of revenue. The next year, you raise the prices of your products, so revenue goes up to $110. Your office overhead hasn’t changed, so it remains at $30. Then, your SG&A as a % of revenue will have gone down to 27%. Here, we see that that’s not the case. In 2014, revenue spiked up, so SG&A did go down from 35.5% to 28.7%. Since revenue increased every year since then, we would expect SG&A % of revenue to decrease as well, but instead, it crept up. *NOTE* So, we need to investigate SG&A further.
- EBITDA – EBITDA margin is arguably the most important margin. It is a more accurate reflection of cash flow than net profit margin since net profit margin includes non-cash items such as depreciation & amortization and non-recurring income and expenses. EBITDA also captures the business’s overhead and utilization more than other margins. Here, we see that EBITDA margin spiked up in 2014, because as we saw, 2014 saw a huge jump in revenue. Looking at 2014 – 2017, EBITDA margin has been somewhat stable, but in the most recent year, we saw a slight dip. That was a result of the operating expense increasing despite it being a relatively fixed cost. We made a note above to read up on this further, so we shall do that in the Notes.
- Depreciation & amortization (“D&A”) – D&A is most likely a straight-line calculation since it’s been about the same % over the last few years. We see that D&A went up in relation to a revenue increase in 2017, so Acme must have invested in a fixed asset this year. *NOTE* Investigate further into whether Acme is investing in fixed assets and if that is to replace existing assets or expand with new technology.
- Operating profit margin (EBIT) – With the impact of D&A, we see that the operating profit margin is lower in the most recent year. We’ve already denoted the reasons for the lower margin, and we need to take a closer look at operating expense and fixed asset purchases.
- Interest & other income – Since these numbers are marginal, I won’t be taking a deep dive into these numbers. If I see a significant non-recurring income or expense or any unusually large number in these lines, then I would investigate further.
- Income tax expense – Tax on the income statement is different from tax that is actually reported and paid. This is because there are different rules for tax and accounting. For example, if a company has investors, the owner might be inclined to use a faster depreciation method so that they can deduct income and pay less taxes. Meanwhile, they might use a slower depreciation method on the income statement so that it reports a higher net income.
- Net profit margin – As you can see, depreciation, interest, other income, and taxes make it hard to judge net income on its own. I would much prefer to analyze EBITDA and the line items that come before EBITDA.
Step 4: Dig Through Notes (Analysis Example)
In Step 4, we investigate our questions from analyzing the common size income statement items further by looking into the raw data or in the Notes. Question and finding as follows.
- Why did SG&A (aka overhead) increase in 2017? This is what I found in the Notes in relation to that. “The increase in SG&A expenses was primarily the result of increases in delivery costs and sales commissions which resulted from higher sales, incremental fixed costs resulting from the acquisition of Spill Magic assets, and higher headcount, which include compensation and recruiting costs.” Higher commissions is no surprise since it moves with revenue and revenue went up in 2017. What’s more interesting is the acquisition of Spill Magic assets and higher headcount, including recruiting costs. I’ll go into this more in Step 5 when we put everything together.
- Why are fixed assets higher? Okay, so the Notes doesn’t explain what the addition to fixed assets was for, but I’m guessing it is related to the Spill Magic assets that Acme acquired in February 2017.
- What are they doing differently to increase revenue every year? What I found was that increase in sales primarily came from 2 sources: e-commerce sales and growth in international sales.
The analysis can go on more but for the purpose of illustrating how to analyze common size income statement with an example, this should do. Finally, on to the last step.
Step 5: Put It All Together (Analysis Example)
From what we found in Steps 1-4, this is how I would curate the story for Acme’s current state.
Acme is an old traditional company that manufactures cutting and sharpening tools in the office space, schools, industrial markets. They sell internationally.
Acme has really embraced digital e-commerce sales. This is especially important for an old traditional business to have implemented.
They’ve positioned themselves well with having a lean line of products that people will always need despite everything becoming digital and AI.
They’re beefing up the team, particularly in marketing, which shows that leadership is good at reacting to market changes; i.e. digital success comes from good products and marketing
Acme’s acquisition of Spill Magic is an entry into an adjacent market. Spill Magic sells powder absorbent to clean up spills such as oils and is sold mainly in large retail stores. So, these products are used in home hardware and industrial sectors. Perhaps Acme is expanding into adjacent markets because the cutting tools, i.e. their core product, alone is either declining or stagnant.
But the fact that they’re recruiting more people means they’re forecasting higher sales.
Their fixed assets remained stable over the last few years except for acquiring Spill Magic’s assets, which suggests that the company is careful to keep its operation stable rather than expanding too large, too fast. It makes sense that leadership is keeping the company conservative since the company has traditional and legacy operations.
Overall, Acme’s strategy seems to me is to continue its focus on digital presence. They’re keeping margins as stable as possible without any big changes. They’re conservative in their expansion, and slowly exploring new adjacent markets that they can roll into their existing vertical chain as long as they can synergize.
Wrap-Up
In the above example of a common size analysis, you saw that the 5 steps take a bit of digging around for information. If you’re analyzing your own company, then you will already know what the company’s strategic direction is, but it is still good to go through the 5-step exercise, because you don’t know what will jump out at you.
Note that my analysis above is just an example to illustrate how to go through the 5 steps and someone else might have a different view. If I were working with the company to form a strategy together to improve the business, of course, I would spend a lot more time in drilling down to the details not found on the income statement.
Another important note is that as good as data is, sometimes people are the answer to getting answers. Leverage your people in the company to learn how they manage their function and put the pieces together. This is also important to make sure everyone is aligned with the company’s direction.
How to Analyze Income Statements with Ratios
In addition to the 5 steps of analyzing common size income statements above, I suggest you put these three ratios into your arsenal of income statement analysis as well.
Return on Assets (ROA)
Return on Assets is traditionally calculated as Net Income / Total Assets. Net Income comes from the income statement and the Total Assets comes from the balance sheet. But, this isn’t as useful, because as we saw above, net income includes non-cash items and nonrecurring items that muddy what we’re trying to accomplish.
A more useful form of Return on Assets is:
ROA = After-Tax Cash Flow / Total Assets
A simple, intuitive calculation of after-tax cash flow is:
After-tax Cash Flow = EBITDA – Changes in Working Capital – Capital Expenditure – Tax
(i.e. Changes in working capital is basically a way of calculating how much cash has actually changed hands in the non-cash items on the balance sheet. Capital expenditure is the cash spent on fixed assets for that period. See Part 4: Cash Flow Statement for more on these topics).
After-tax cash flow is more useful, because it takes out the non-cash effect and as a result, we can more clearly see what the net cash profit is per dollar of assets.
ROA measures the profit per dollar of assets the company has to work with to generate profit. ROA is the most useful for an asset intensive business like a manufacturing business.
You can use ROA to measure the profitability of your company in relation to the assets by analyzing it in these ways:
- Compare your company’s ROA to other competitors’ ROA of similar size in the same industry.
- Compare the ROA over a period of time. An increase in ROA could indicate that your company is increasing productivity or utilization of resources. If ROA is decreasing but you haven’t made any new investments in assets, then there are areas of improvement in either production utilization or working capital management.
- Calculate ROA for each business unit (ake profit center, segment) that comprises your company. For example, your business might have multiple manufacturing plants where each plant has its own designated workers that work standalone except for corporate overhead resources. This allows you to compare which business unit is profitable given the assets allocated to that profit center.
Return on Equity (ROE)
Return on Equity is calculated as Net Income / Shareholders’ Equity. Net Income is from the income statement, similar to ROA, and Shareholders’ Equity is from the balance sheet.
ROE measures the profit of the company for every dollar the owner has invested into the company.
As the company grows, you’d expect the ROE to increase. When there is a period of time where ROE dips significantly, then it’s a signal to determine whether the company’s profit is dipping, because of internal problems or the inability to meet its sales and profit targets.
Another purpose of using ROE is to measure a company’s effectiveness in using leverage (i.e. borrowed money). Let me explain.
Without any debt, ROE and ROA would be the same. Think about it. On the balance sheet, Shareholders’ Equity + Debt = Assets. If Debt is 0, then Shareholders’ Equity is equal to Assets.
The more debt there is, the higher the ROE, and that means for investors, there’s more return for their money. This makes the company more attractive in the eyes of the investors/owners. And they would be happy that the company is using debt effectively to bring in more return.
However, the pitfall is the danger of overleveraging to the point where the company is at the risk of defaulting on their loans.
So, when you use ROE to measure the company’s profitability and effectiveness of using leverage, you should also be looking at it in conjunction with the Debt to Equity ratio. D/E ratio that exceeds a certain number is a red flag, as discussed in Part 2.
Interest Coverage Ratio (ICR)
If the company does have debt, another important analysis of the income statement is the Interest Coverage Ratio, which is calculated as:
Interest Coverage Ratio = EBITDA / Debt Servicing Cost
Debt Servicing Cost is comprised of interest expense and the portion of principal that is due on the loan, if any.
ICR is a calculation often required by the lenders. These requirements are called covenant tests (see Funding for more on this topic). They want to know if the company can make enough money to pay for the debt servicing costs for a given period and have enough cushion to sustain its operations.
Depending on the debt terms, the covenant test for ICR will differ. But generally speaking, a lender can require that the interest coverage ratio for any given period be at least 2.0 times or at least 4.0 times. That means, EBITDA should be twice as much as or four times as much as the debt servicing cost. It really depends on the size of your company, the historical profitability, the financial analysis sophistication of your company, management capability, etc.
Also, note that some lenders require the numerator to be After-Tax Cash Flow (see above for definition) / Debt Servicing Cost.
The interest coverage ratio, in other words, tells you how much liquidity cushion the company has. Look at the coverage ratio in conjunction with Debt to Equity in order analyze and gauge the financial riskiness of the company, i.e. too much debt? Enough room for more debt without risk?
Summary
To analyze an income statement, we looked at the rationale for converting the income statement to common size. Common size is when you divide each line on the income statement by the revenue.
Gather 5 years of income statement as Step 1, convert to common size, and go through each line from top to bottom to explain the performance of different aspects of the business. Specifically, to explain why the gross profit margins or EBITDA margins were up or down in a given year.
In the example analysis shown above, we used Acme United as an example to go through each line of the common size to explain the company’s performance. We then looked through the Notes section of the financial statement.
If you’re analyzing your own company, then you might have more raw data and information outside of the financial statement. Or, speaking with your team members will answer questions you might have from analyzing the common size.
Analyzing the income statement is just a part of the financial analysis. You should analyze the balance sheet (Part 2 of the series) and the cash flow statement (Part 4 of the series) together.
Let’s go on to the last section of the financial statements, Cash Flow Statements.