
In this article, we will explore the EBITDA multiples for distribution companies across different industry sectors.
The first thing to note is that when you say “distribution,” there are different types of distribution companies and channels. Especially now, where distribution is an important part of the digital space.
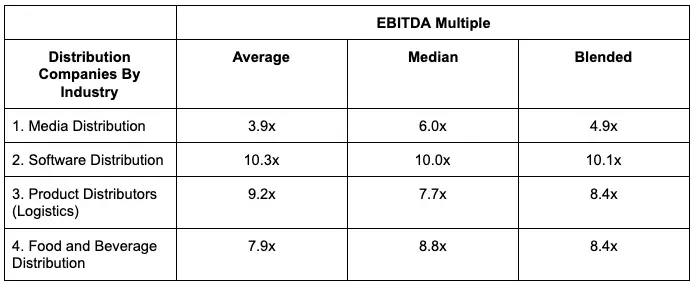
So, first we’ll look at different industry sectors you’ll find distribution companies in. And in each section, we will show their EBITDA multiples.
Note that our examples focus on microcap companies with a market cap between $10 million and $200 million.
Here’s a summary of the EBITDA multiples for distribution companies by industry sector.
I won’t get into how to use EBITDA multiple to value a company here. I explain using manufacturing companies as an example right here.
EBITDA Multiple Methodology
First, a quick word on methodology.
For each distribution industry sector below, a similar methodology was followed.
First, the distribution companies in that sector were screened on Capital IQ or Nasdaq (databases of public companies).
For the distribution companies in each industry sector, the criteria included market cap size between $10 million and $200 million, public companies, and positive EBITDA.
How To Use Valuation Multiples To Value a Company
For those who are not familiar with using valuation multiples to value companies or those who are but need a refresher, I wrote posts detailing exactly how you can do that.
Hopefully you can use them as helpful guides. Click on the link below to go to the post.
- How to value a company based on revenue
- How to value a company based on EBITDA
- How to value a company based on earnings
- How to find your own valuation multiples
- Other posts on how to value a company
List of Distribution Companies Used in the Data Set
You can dissect distribution companies by industry sector, their role in marketing, by channels, in numerous ways.
Here, we show the EBITDA multiples for distribution companies by industry sector.
Click to jump to the industry section to see the data set:
- Media Distribution
- Software Distribution
- Product Distributors (Logistics)
- Food and Beverage Distribution
1. Media Distribution
| Media Distribution Company | Market Cap
($mm) |
Enterprise
Value ($mm) |
EBITDA ($mm) | EV/EBITDA, i.e.
EBITDA Multiple |
| Amarin Printing and Publishing Public Company Limited | 161.2 | 129.40 | – | – |
| Beijing Media Corporation Limited | 57.3 | 31.20 | -38.9 | – |
| Bison Finance Group Limited | 166.1 | 116.00 | -2.19 | – |
| Champion Technology Holdings Limited | 17.2 | 49.70 | -546.2 | – |
| China Digital Culture | 45.2 | 71.40 | 7.62 | 9.4x |
| CL Educate Limited | 25 | 23.90 | 3.99 | 6.0x |
| Connect Group PLC | 127.4 | 236.20 | 54.4 | 4.3x |
| Dahe Media Co., Ltd. | 14.3 | 52.00 | 2.6 | 20.0x |
| Educational Development Corporation | 65.1 | 77.30 | 10.1 | 7.7x |
| Fame Productions, Inc. | 38.2 | – | – | – |
| Forside Co., Ltd. | 54.6 | 55.00 | -0.638 | – |
| Fotex Holding S.E. | 89.7 | 154.20 | 22 | 7.0x |
| GMM Grammy Public Company Limited | 186.2 | 190.60 | -2.93 | – |
| GRC International Group plc | 83.1 | 80.90 | -2.27 | – |
| Independent News & Media PLC | 104.5 | 2.91 | 32.9 | 0.1x |
| JLS Co.,Ltd. | 94.5 | 97.10 | 12.8 | 7.6x |
| Lee Enterprises, Incorporated | 167.9 | 614.60 | 120.1 | 5.1x |
| Lion Rock Group Limited | 144.2 | 122.30 | 25.5 | 4.8x |
| LONGTU KOREA Inc. | 108.7 | 117.10 | 8.97 | 13.1x |
| M Pictures Entertainment Public Company Limited | 57 | 56.30 | -0.496 | – |
| Magnus Concordia Group Limited | 87.3 | 77.80 | 1.39 | – |
| Media Chinese International Limited | 95.7 | 41.90 | 18.3 | 2.3x |
| Mondo TV S.p.A. | 59.9 | 50.00 | 27 | 1.9x |
| MPG Corporation Public Company Limited | 15.6 | 15.80 | -1.5 | – |
| Nation Multimedia Group Public Company Limited | 29.9 | 66.10 | -8.16 | – |
| News Network Corporation Public Company Limited | 21.7 | 30.90 | -7.13 | – |
| Ovato Limited | 62.2 | 86.40 | 32.6 | 2.7x |
| Sasbadi Holdings Berhad | 23.2 | 34.20 | 3.35 | 10.2x |
| SE-Education Public Company Limited | 35.1 | 42.20 | – | – |
| SEEC Media Group Limited | 16.2 | 2.11 | -11 | – |
| Sing Tao News Corporation Limited | 98.2 | 32.00 | 13.1 | 2.4x |
| Space Shower Networks Inc. | 59.1 | 36.50 | 4.62 | 7.9x |
| Star Media Group Berhad | 141.4 | 64.40 | -28.7 | – |
| The Quarto Group, Inc. | 15.4 | 87.90 | 10.5 | 8.4x |
| Tihama Advertising and Public Relations Co. | 93.4 | 92.60 | 0.28 | – |
| Tiso Blackstar Group SE | 65.6 | 145.40 | 29 | 5.0x |
| Tong Yang Moolsan Co., Ltd. | 128.3 | 234.90 | 13.5 | 17.4x |
| Yleiselektroniikka Oyj | 23.6 | 21.70 | 4.12 | 5.3x |
2. Software Distribution
| Software Distribution Company | Market Cap
($mm) |
Enterprise
Value ($mm) |
EBITDA ($mm) | EV/EBITDA, i.e.
EBITDA Multiple |
| 1Spatial Plc | 43.2 | 45.1 | -0.515 | – |
| 3U Holding AG | 37.4 | 48.4 | 8.34 | 5.8x |
| A-Smart Holdings Ltd. | 43.9 | 39.3 | -0.126 | – |
| aamra networks limited | 38.8 | 39.1 | 4.28 | 9.1x |
| aamra technologies limited | 19.7 | 25.9 | 2.28 | 11.4x |
| AB S.A. | 86.4 | 144.8 | 29.1 | 5.0x |
| AbaCore Capital Holdings, Inc. | 37.5 | 40.9 | 6 | 6.8x |
| ABC Data S.A. | 43.3 | 70.3 | 9.76 | 7.2x |
| Ahsay Backup Software Development Company Limited | 12.2 | 1.35 | 1.32 | 1.0x |
| Altia Consultores, S.A. | 155.3 | 134.6 | 11.1 | 12.1x |
| Alviva Holdings Limited | 177.6 | 192.6 | 57.4 | 3.4x |
| APC Technology Group PLC | 15.9 | 19.8 | 1.45 | 13.7x |
| Applied Technology Co., Ltd. | 30.9 | – | 3.35 | – |
| ARB Holdings Limited | 73 | 71.9 | 14.1 | 5.1x |
| Arena Bilgisayar Sanayi ve Ticaret A.S. | 23.5 | 32.3 | 5.74 | 5.6x |
| ASBISc Enterprises Plc | 34.6 | 73.7 | 28.9 | 2.6x |
| Asseco South Eastern Europe S.A. | 183.4 | 152.2 | – | – |
| Automated Systems Company K.P.S.C. | 38.9 | 4.55 | 2.5 | 1.8x |
| CAICA Inc. | 94.3 | 86 | -2.39 | – |
| Cerebra Integrated Technologies Limited | 44 | 34.3 | 6.78 | 5.1x |
| Chander Electronics Corp. | 34.2 | 36.4 | 1.39 | 26.2x |
| China Automation Group Limited | 136 | 315.6 | 7.4 | 42.6x |
| China Dynamics | 67.7 | 66.8 | -18 | – |
| China Netcom Technology Holdings Limited | 45.2 | 40.4 | 0.055 | – |
| China Outfitters Holdings Limited | 101.8 | -12.8 | 20.8 | -0.6x |
| Chuan Huat Resources Berhad | 14.3 | 62.6 | 3.97 | 15.8x |
| Compuage Infocom Limited | 13.2 | 53 | 10.4 | 5.1x |
| Cosmo Bio Company,Limited | 53.2 | 37.2 | 4.58 | 8.1x |
| Crimson Tide plc | 15.8 | 15.4 | 0.726 | 21.2x |
| CSP Inc. | 41.9 | 21.8 | -1.14 | – |
| CTCI Advanced Systems Inc. | 31.9 | 14.2 | 2.83 | 5.0x |
| CWG Plc | 17.7 | 17.6 | -0.38 | – |
| D-Link | 36.4 | 33.2 | 2.81 | 11.8x |
| Daffodil Computers Limited | 28.4 | 28.7 | 1.31 | 21.9x |
| Dagang NeXchange Berhad | 136.1 | 136.9 | 13.3 | 10.3x |
| Datagate Bilgisayar Malzemeleri Ticaret Anonim Sriketi | 43.1 | 41 | 3.11 | 13.2x |
| DeClout Limited | 64.1 | 103.5 | 6.04 | 17.1x |
| DGB Asia Berhad | 24.2 | 15.2 | -1.06 | – |
| Digital Bros S.p.A. | 86.1 | 94.9 | 4.17 | 22.8x |
| Digiworld Corporation | 42.3 | 75.3 | 6.37 | 11.8x |
| Dimension Computer Technology Co., Ltd. | 13.3 | 18.8 | 0.7 | 26.9x |
| Disway S.A. | 55.2 | 79.8 | 12.2 | 6.5x |
| Diversified Gateway Solutions Berhad | 16.5 | 10.7 | 0.087 | – |
| Ducon Infratechnolgies Limited | 15.7 | 27 | 2.2 | 12.3x |
| DynTek, Inc. | 43.5 | – | 9.23 | – |
| EDOM Technology Co., Ltd. | 98.5 | 251.4 | 31.3 | 8.0x |
| Edvance International Holdings Limited | 68.9 | 64.2 | 4.91 | 13.1x |
| eMarine Global Inc. | 22.9 | 25.5 | -0.852 | – |
| FueTrek Co., Ltd. | 42.4 | 27 | 1.52 | 17.8x |
| Futong Technology Development Holdings Limited | 31.7 | 35.5 | 2.39 | 14.9x |
| Galaxy Next Generation, Inc. | 25.3 | 32.2 | – | – |
| GBST Holdings Limited | 82.8 | 75.9 | 7.7 | 9.9x |
| GET Holdings Limited | 22.7 | 11.5 | 1.86 | 6.2x |
| GrandTech C.G. Systems Inc. | 78.4 | 74.4 | 9.16 | 8.1x |
| Helios and Matheson Analytics Inc. | 16 | -4.93 | -316.4 | – |
| HIMS Co., Ltd. | 75.7 | 66.7 | -2.25 | – |
| House of Investments, Inc. | 72.1 | 382.2 | 53.9 | 7.1x |
| ICO Group Limited | 41.3 | 43.2 | 1.36 | 31.8x |
| Indeks Bilgisayar Sistemleri Mühendislik Sanayi ve Ticaret Anonim Sirketi | 85.7 | 105.6 | 9.84 | 10.7x |
| Innelec Multimédia SA | 15.4 | 16 | 2.22 | 7.2x |
| Innotech Corporation | 138.5 | 144.4 | 26.7 | 5.4x |
| Intelligent Wave Inc. | 157.5 | 136 | 10.6 | 12.8x |
| Internetworking and Broadband Consulting Co.,Ltd. | 57 | 51.8 | 1.93 | 26.8x |
| IPOPEMA Securities Spólka Akcyjna | 11 | – | – | – |
| ITbook Holdings Co., Ltd. | 77.6 | 81.3 | 1.92 | 42.3x |
| JCH Systems, Inc. | 93.8 | 90.2 | 16.6 | 5.4x |
| Jeong Moon Information. Co., Ltd | 32.1 | 31.2 | -0.838 | – |
| K WAY Information Corporation | 27.7 | 17.4 | 1.53 | 11.4x |
| K3 Business Technology Group plc | 125.5 | 136.6 | -2.91 | – |
| Kantone Holdings Limited | 11.6 | 2.97 | -208.2 | – |
| Karin Technology Holdings Limited | 52.5 | 73.4 | 5.9 | 12.4x |
| Kiattana Transport Public Company Limited | 41.3 | 34 | 4.24 | 8.0x |
| Komputronik S.A. | 10.6 | 28.1 | 4.28 | 6.6x |
| Krungdhep Sophon Public Company Limited | 55.7 | 49.5 | – | – |
| Kyoei Sangyo Co., Ltd. | 44.5 | 94.3 | 7.47 | 12.6x |
| Kyokuto Boeki Kaisha, Ltd. | 98.9 | 57 | 9.97 | 5.7x |
| Kyoritsu Computer & Communication Co.,Ltd. | 20.1 | 13.6 | 3.78 | 3.6x |
| Loto Interactive Limited | 28.9 | 8.58 | -5.85 | – |
| Loxley Public Company Limited | 159.4 | 243.8 | 0.485 | – |
| ManagePay Systems Berhad | 24.4 | 16.3 | -1.01 | – |
| Marubun Corporation | 173.9 | 481 | 45.7 | 10.5x |
| Media Kobo, Inc. | 32.4 | 25.2 | 1.16 | 21.7x |
| Metro Systems Corporation Public Company Limited | 94.4 | 105.3 | 11.9 | 8.8x |
| Metrofile Holdings Limited | 73.2 | 118.7 | 19.7 | 6.0x |
| Microdata S.A. | 49.3 | 55.3 | – | – |
| Microlink Solutions Berhad | 18.5 | 26.3 | -12.4 | – |
| Minori Solutions Co., Ltd. | 131.5 | – | – | – |
| MMag Holdings Berhad | 41.8 | 33.3 | -4.96 | – |
| Multi-Chem Limited | 48.7 | 28.7 | 9.36 | 3.1x |
| N2N Connect Berhad | 130.8 | 98 | 7.23 | 13.6x |
| Nanjing Putian Telecommunications Co., Ltd. | 97.2 | 152.7 | 2.22 | 68.8x |
| NARASOFT Co.,Ltd. | 18.6 | – | – | – |
| Nihon Denkei Co.,Ltd. | 108 | 208.8 | 29.6 | 7.1x |
| Niraku GC Holdings, Inc. | 100.6 | 102.1 | 39.6 | 2.6x |
| Omesti Berhad | 44.5 | 59.2 | -35.9 | – |
| Onward Technologies Limited | 13.5 | 16.7 | 1.42 | 11.8x |
| OPASNET co., Ltd. | 42.4 | – | 2.79 | – |
| OPTeam Spólka Akcyjna | 12.4 | 13 | -0.276 | – |
| OSOS Holding Group Company K.P.S.C. | 34.3 | 7.69 | 0.165 | 46.6x |
| P.T. Metrodata Electronics Tbk | 169.7 | 204.4 | 39 | 5.2x |
| Pacific & Orient Berhad | 67 | 78.8 | 7.73 | 10.2x |
| Petrovietnam General Services Joint Stock Corporation | 32.4 | 78.9 | 11.8 | 6.7x |
| POBIS TNC CO., Ltd | 65.2 | 42.6 | 0.994 | 42.9x |
| Positivo Tecnologia S.A. | 54.7 | 125.9 | -1.35 | – |
| Premier Technology Public Company Limited | 59 | 60 | 7.78 | 7.7x |
| Prestariang Berhad | 51 | 62 | 11 | 5.6x |
| Privasia Technology Berhad | 11 | 17.4 | 1.6 | 10.9x |
| Professional Computer Technology Limited | 29.4 | 13.6 | 1.38 | 9.9x |
| PS IT Infrastructure & Services Limited | 32.1 | 32.2 | 0.419 | 76.8x |
| PT Indal Aluminium Industry Tbk | 20.1 | 70.7 | 6.98 | 10.1x |
| Quest Holdings S.A. | 196.7x | 173.4 | 51.8 | 3.3x |
| Rand Worldwide, Inc. | 116.8 | – | – | – |
| Rapac Communication & Infrastructure Ltd. | 41.6 | 306.7 | 5.08 | 60.4x |
| Rikei Corporation | 27.5 | 8.31 | 1.24 | 6.7x |
| Ryoyu Systems Co., Ltd. | 89.2 | 41.3 | 22.3 | 1.9x |
| Saigon Telecommunication & Technologies Corporation | 16.9 | – | – | – |
| Sanai Health Industry Group Company Limited | 130.9 | 148.9 | -4.28 | – |
| Sasbadi Holdings Berhad | 23.2 | 34.2 | 3.35 | 10.2x |
| Scott Technology Limited | 137.5 | 134.3 | 12.8 | 10.5x |
| SE-Education Public Company Limited | 35.1 | 42.2 | – | – |
| Serial System Ltd | 55.6 | 248.8 | 29.8 | 8.3x |
| SEVAK Limited | 31.6 | 21.6 | 1.19 | 18.2x |
| SGA Co., Ltd. | 48.2 | 97.1 | -2.29 | – |
| SGA Embedded Co., Ltd. | 12.3 | – | – | – |
| Shanghai Jiaoda Withub Information Industrial Company Limited | 17.4 | 10.2 | -0.815 | – |
| Shenghua Lande Scitech Limited | 17.4 | 11.3 | -0.876 | – |
| SilverSun Technologies, Inc. | 15.7 | 15.7 | 1.01 | 15.5x |
| Simat Technologies Public Company Limited | 29.9 | 46.5 | 2.98 | 15.6x |
| Singapore eDevelopment Limited | 24.5 | 30.6 | -4.73 | – |
| SiS International Holdings Limited | 142.1 | 536.4 | 13.9 | 38.6x |
| Softcreate Holdings Corp. | 186.4 | 153 | 21.5 | 7.1x |
| Softlogic Holdings PLC | 124.7 | 356.7 | 52.1 | 6.8x |
| Solomon Technology Corporation | 112.9 | 59.2 | 6.06 | 9.8x |
| Somoto Ltd. | 40.5 | 30.4 | 10.4 | 2.9x |
| Starcom Information Technology Limited | 20.7 | – | – | – |
| StrikeForce Technologies, Inc. | 14.2 | 20 | -2.27 | – |
| Sung Gang Asset Management Corp.Limited | 23.9 | 22.8 | -1.68 | – |
| Sunwah International Limited | 21.2 | 21.9 | -0.927 | – |
| SVOA Public Company Limited | 39.7 | 85.1 | 1.06 | 80.3x |
| Talex S.A. | 10.9 | 11.9 | 3.35 | 3.6x |
| TANSH Global Food Group Co., Ltd | 76.1 | 78.2 | 42.3 | 1.8x |
| Teckwah Industrial Corporation Ltd | 72.7 | 52.5 | 15.4 | 3.4x |
| Terilogy Co., Ltd. | 139.4 | 139.8 | 1.42 | – |
| Thanasiri Group Public Company Limited | 17.5 | 31.3 | 0.446 | 70.2x |
| The Fukushima Bank, Ltd. | 80.2 | – | – | – |
| The Kita-Nippon Bank, Ltd. | 161.4 | – | – | – |
| Theta Edge Berhad | 10.7 | 1.39 | 1.23 | 1.1x |
| Tokyo Electron Device Limited | 174.7 | 390.9 | 34.4 | 11.4x |
| Tomita Co., Ltd. | 50 | 5.68 | 9.68 | 0.6x |
| Trade-Van Information Services Co. | 168.3 | 136 | 13.2 | 10.3x |
| Trakm8 Holdings PLC | 18.6 | 26.1 | 0.278 | 93.9x |
| Trigold Holdings Limited | 46.7 | 48 | – | – |
| UNIPOINT Corp. | 10.7 | – | – | – |
| United Power of Asia Public Company Limited | 76.8 | 24.8 | -4.67 | – |
| Unitrontech Co., Ltd. | 56.5 | 87.5 | 5.51 | 15.9x |
| Virtualtek Corp | 25.7 | 27.6 | -0.543 | – |
| Vixtel Technologies Holdings Limited | 57 | 47.3 | 3.5 | 13.5x |
| Vortex Consolidated Berhad | 10.9 | 7.68 | 0.615 | 12.5x |
| Vsolar Group Berhad | 18 | 16.8 | -0.179 | – |
| VSTECS Berhad | 43.6 | 30.2 | 7.61 | 4.0x |
| Wayi International Digital Entertainment Co., Ltd. | 27.9 | 26.4 | -1.54 | – |
| Wayside Technology Group, Inc. | 52.4 | 46 | 7.08 | 6.5x |
| Writeup Co.,Ltd. | 23.7 | 9.59 | – | – |
| Xin Chio Global Co., Ltd. | 19.7 | 32.3 | 2.29 | 14.1x |
| Yau Lee Holdings Limited | 83.7 | 301.9 | 9.12 | 33.1x |
| Yleiselektroniikka Oyj | 23.6 | 21.7 | 4.12 | 5.3x |
| Zero One Technology Co., Ltd. | 90.4 | 66.9 | 9.08 | 7.4x |
| Zungwon En-Sys Inc. | 54.9 | 59.6 | 0.769 | 77.5x |
3. Product Distribution (General Product Logistics Distributor)
| Product Distribution Company | Market Cap
($mm) |
Enterprise
Value ($mm) |
EBITDA ($mm) | EV/EBITDA, i.e.
EBITDA Multiple |
| Agra Limited | 10.7 | 30.1 | 7 | 4.3x |
| Aiko Corporation | 19.1 | 17.9 | 2.66 | 6.7x |
| Amir Marketing and Investments in Agriculture Ltd. | 118.8 | 134.7 | 16.6 | 8.1x |
| Ben Thanh Trading & Service Joint Stock Company | 19.7 | – | – | – |
| Brown and Company PLC | 62.6 | 272.7 | 9.24 | 29.5x |
| Chinlink International Holdings Limited | 149 | 424.7 | 4.73 | – |
| Create Corporation | 27.8 | 52.8 | 4.18 | 12.6x |
| Denkyosha Co.,Ltd. | 66.5 | 42.2 | 0.725 | 58.2x |
| DKSH Holdings | 95.2 | 85.3 | 18.8 | 4.5x |
| E. Bon Holdings Limited | 40.6 | 30.7 | 8.23 | 3.7x |
| Elton International Trading Company S.A. | 42.1 | 66.6 | 8.95 | 7.4x |
| Eltrak S.A. | 36.7 | 57.5 | 10.9 | 5.3x |
| Engtex Group Berhad | 84.9 | 208.6 | 19 | 11.0x |
| FosRich Company Limited | 15.9 | 23.6 | 1.41 | 16.7x |
| Fujii Sangyo Corporation | 94.4 | 21.2 | 29 | 0.7x |
| Generic Pharmasec Limited | 39.2 | 39.4 | 0.01 | – |
| Global Strategic Group Limited | 58.1 | 100.9 | -2.97 | – |
| Gratitude Infinite Public Company Limited | 49.5 | 42.9 | 4.3 | 10.0x |
| Greater China Financial Holdings Limited | 191.4 | 183.3 | -2.85 | – |
| GS Global Corp. | 191.6 | 575.5 | 67 | 8.6x |
| Hafary Holdings Limited | 53.9 | 156.7 | 14.4 | 10.9x |
| Harrisons Holdings | 63.8 | 84.5 | 10.6 | 8.0x |
| Hashimoto Sogyo Holdings Co., Ltd. | 126.4 | 188.1 | 24.4 | 7.7x |
| HGL Limited | 16.8 | 16.5 | 2.17 | 7.6x |
| Hong Kong Shanghai Alliance Holdings Limited | 53.9 | 239.2 | -10.3 | – |
| Innovative Pharmaceutical Biotech Limited | 77.4 | 266.5 | -3.11 | – |
| Intema Insaat ve Tesisat Malzemeleri Yatirim ve Pazarlama A.S. | 28.3 | 28 | -4.38 | – |
| Jiyi Household International Holdings Limited | 86.3 | 92.9 | 4.51 | 20.6x |
| Kitakei Co., Ltd. | 73.5 | -10.2 | 7.7 | -1.3x |
| KPS Consortium Berhad | 18.3 | 57.1 | 5.83 | 9.8x |
| Kumpulan Perangsang Selangor Berhad | 172.2 | 307.3 | 16.3 | 18.9x |
| Kushal Limited | 117 | 118.6 | 19 | 6.2x |
| Kuwazawa Trading Co. Ltd. | 54.2 | 43.6 | 13.2 | 3.3x |
| Lion Forest Industries Berhad | 24 | 1.3 | 4.1 | 0.3x |
| Loco Hong Kong Holdings Limited | 26.4 | 19.6 | -1.37 | – |
| Malmbergs Elektriska AB | 59.8 | 53.6 | 6.48 | 8.3x |
| Marshall Monteagle PLC | 47.3 | 66.5 | 15.2 | 4.4x |
| Metroglobal Limited | 12 | 11.6 | 3.84 | 3.0x |
| Mitsui Matsushima Holdings Co., Ltd. | 153.7 | 101.7 | 42.5 | 2.4x |
| Modern India Limited | 12.7 | 9 | 0.172 | 52.3x |
| Nice Holdings, Inc. | 73 | 814.5 | 24.4 | 33.4x |
| Ochi Holdings Co., Ltd. | 153 | 152.6 | 23.1 | 6.6x |
| Parker Corporation | 120.3 | 109.4 | 45 | 2.4x |
| Podak Co., LTD. | 44.7 | 49 | 5.69 | 8.6x |
| Pritika Auto Industries Limited | 38 | 45.1 | 3.8 | 11.9x |
| PT Arita Prima Indonesia Tbk | 15.1 | 23 | 2.98 | 7.7x |
| PT Surya Pertiwi Tbk | 182.4 | 220.4 | – | – |
| Rikengreen Co., Ltd. | 27.9 | 3.85 | 5.43 | 0.7x |
| Sakai Trading Co., Ltd. | 25.7 | 23.9 | 5.61 | 4.3x |
| Samchem Holdings Berhad | 41.2 | 89.7 | 8.63 | 10.4x |
| Samson Paper Holdings Limited | 71.2 | 371.8 | 30.7 | 12.1x |
| Sat Industries Limited | 42.2 | 54.5 | 1.75 | 31.1x |
| Sato Shoji Corporation | 176.4 | 350.2 | 46.5 | 7.5x |
| Shoei Yakuhin Co.,Ltd. | 32.8 | 24.5 | 3.4 | 7.2x |
| SP Corporation Limited | 15.6 | 7.87 | 0.532 | 14.8x |
| Standard Industries Limited | 14.1 | 15.3 | -2.32 | – |
| Straits Inter Logistics Berhad | 32.9 | 39.7 | 1.57 | 25.3x |
| Takashima & Co., Ltd. | 74.3 | 89.6 | 19 | 4.7x |
| Tanaka Co.,Ltd. | 49.3 | 73.5 | 10.6 | 6.9x |
| TECHNO ASSOCIE Co.,Ltd. | 187.1 | 77.6 | 41.5 | 1.9x |
| Thai Capital Corporation Public Company Limited | 14.1 | 16.6 | 0.719 | 23.1x |
| The State Trading Corporation of India Ltd. | 108.8 | 513.8 | -11.7 | – |
| Torre Industries Limited | 36.8 | 26.5 | 9.85 | 2.7x |
| Unic Technology Corp. | 29.9 | 54.6 | 3.82 | 14.3x |
| Union Petrochemical Public Company Limited | 28 | 39.7 | 4.03 | 9.9x |
| Vogiatzoglou Systems S.A. | 14.2 | 15.4 | 2.27 | 6.8x |
4. Food and Beverage Distribution
| Food & Beverage Distribution Company | Market Cap
($mm) |
Enterprise
Value ($mm) |
EBITDA ($mm) | EV/EBITDA, i.e.
EBITDA Multiple |
| Anaam International Holding Group Company | 64.6 | 63.8 | 1.54 | 41.4x |
| Asia Grocery Distribution Limited | 20.7 | 13.5 | 0.922 | 14.6x |
| Asmo Corporation | 46.2 | 11.6 | 11.4 | 1.0x |
| B & S International Holdings Ltd. | 48.9 | 51 | 6.99 | 7.3x |
| Ban Loong Holdings Limited | 184 | 186.7 | 0.798 | – |
| Bizim Toptan Satis Magazalari A.S. | 91.8 | 62 | 9.68 | 6.4x |
| BORATR CO., Ltd. | 48.7 | 30 | 8.84 | 3.4x |
| Candy Club Holdings Limited | 16.7 | 17.2 | -6.43 | – |
| Caribbean Producers | 38.8 | 63.6 | 6.59 | 9.7x |
| Celebrate International Holdings Limited | 18.4 | 18.7 | -14.3 | – |
| Chubu Suisan Co., Ltd. | 40.1 | 9.38 | 2.19 | 4.3x |
| Chuo Gyorui Co., Ltd. | 102.8 | 295.3 | 18.8 | 15.7x |
| Colabor Group Inc. | 35 | 114.6 | 13.1 | 8.7x |
| Cool Link | 122.3 | 124.2 | 1.44 | – |
| Daisui Co., Ltd. | 29.5 | 52.9 | 5.73 | 9.2x |
| Daito Gyorui Co., Ltd. | 28.8 | 104.6 | 8.28 | 12.6x |
| Echo Trading Co., Ltd. | 30.3 | 52.9 | 2.79 | 19.0x |
| Envictus International Holdings Limited | 25.6 | 49.3 | -1.54 | – |
| Fresh Express Delivery Holdings Group Co., Limited | 39.8 | 40.9 | 5.41 | 7.6x |
| Freshtrop Fruits Limited | 28.8 | 29.3 | 2.66 | 11.0x |
| G. Willi-Food International Ltd. | 107.2 | 31.7 | 5.79 | 5.5x |
| Goal Forward Holdings Limited | 49.7 | 49.1 | 3.69 | 13.3x |
| Golden Resources Development International Limited | 127.6 | 64.4 | 6.34 | 10.2x |
| Grandeur Products Limited | 75.5 | 82.4 | -0.435 | – |
| Heng Tai Consumables Group Limited | 57.3 | -18.9 | -3.41 | – |
| Hohsui Corporation | 64.2 | 243.6 | 17.2 | 14.2x |
| Hong Kong Food Investment Holdings Limited | 27.4 | 7.91 | -2.13 | – |
| HYUNDAI CORPORATION HOLDINGS Co.,Ltd. | 118.1 | 70.4 | 8.32 | 8.5x |
| Iceland Seafood International hf. | 159.3 | 218.3 | 6.84 | 31.9x |
| Innovative Food Holdings, Inc. | 16.9 | 16.3 | 5.22 | 3.1x |
| Khong Guan Limited | 37.1 | 26.1 | 3.64 | 7.2x |
| Kim Teck Cheong Consolidated Berhad | 21.2 | 66.1 | 1.36 | 48.6x |
| Kitoku Shinryo Co., Ltd. | 53.4 | 167.7 | 10.9 | 15.4x |
| Kuze Co.,Ltd. | 32.8 | 5.28 | 6.3 | 0.8x |
| Lasco Distributors Limited | 103.8 | 95.1 | 9.17 | 10.4x |
| Life On Earth, Inc. | 12.7 | 14 | -0.966 | – |
| Livestock Transport and Trading Company K.P.S.C. | 123.1 | 178.8 | -5.67 | – |
| Merdeka Financial Services Group Limited | 14 | 199.7 | -0.775 | – |
| Myungjin holdings.,Corp. | 27.2 | – | – | – |
| National Agricultural Marketing Company | 63.9 | 72.7 | 4.1 | 17.7x |
| Nousouken Corporation | 154.4 | 149 | -0.704 | – |
| O’will Corporation | 33.2 | 29.7 | 5.02 | 5.9x |
| Ocean One Holding Ltd. | 25.7 | 26.6 | 2.88 | 9.2x |
| Oie Sangyo Co., Ltd. | 101.8 | 96.6 | 12.6 | 7.7x |
| Oomitsu Co., Ltd. | 76.8 | 113.3 | 12.7 | 8.9x |
| Orsero S.p.A. | 139.8 | 202.9 | 26.3 | 7.7x |
| OUG Holdings Inc. | 129.4 | 424 | 27.6 | 15.4x |
| Premier Marketing Public Company Limited | 163.1 | 154.7 | 15.4 | 10.0x |
| PT FKS Multi Agro Tbk | 115.9 | 121.9 | 26.9 | 4.5x |
| S.Ishimitsu & Co.,Ltd. | 31.6 | 80.9 | 7.62 | 10.6x |
| Sakuma Exports Limited | 101.3 | 98.4 | 8.8 | 11.2x |
| Satoh & Co., Ltd. | 132.5 | 22 | 16 | 1.4x |
| Shineroad International Holdings Limited | 44.2 | 20.8 | 5.87 | 3.5x |
| Shinyei Kaisha | 28 | 164.1 | 11.1 | 14.8x |
| Société Tunisienne des Marchés de Gros S.A. | 10.6 | 7.59 | 1.79 | 4.2x |
| Sokensha Co.,Ltd. | 13 | 8.92 | 0.075 | – |
| Stelios Kanakis Industrial and Commercial S.A., Raw Materials for Confectionary, Bakery and Ice-Crea | 34.2 | 25.5 | 3.75 | 6.8x |
| Sunmoon Food Company Limited | 19 | 15.5 | -3.11 | – |
| Tait Marketing & Distribution Co., Ltd. | 28.8 | 29.9 | 1.41 | 21.2x |
| Toho Co., Ltd. | 194.9 | 418.3 | 36.8 | 11.4x |
| Tohto Suisan Co., Ltd. | 81.4 | 84.1 | 16.2 | 5.2x |
| Tokan Co.,Ltd. | 80.3 | -12 | 6.56 | -1.8x |
| Trafco Group B.S.C. | 65 | 75.8 | 8.84 | 8.6x |
| Tsit Wing International Holdings Limited | 156.3 | 136.6 | 16.2 | 8.4x |
| Tsukiji Uoichiba Company, Limited | 20.1 | 75.5 | -1.38 | – |
| Vadilal Enterprises Limited | 10.9 | 13 | 1.53 | 8.5x |
| Verus International, Inc. | 10 | 11.8 | -1.27 | – |
| Willi-Food Investments Ltd. | 68.3 | 38.3 | 5.56 | 6.9x |
| Winner Group Enterprise Public Company Limited | 37.6 | 43.9 | – | – |
| Winning Tower Group Holdings Limited | 15.9 | 16.8 | 1.39 | 12.1x |
| Yamatane Corporation | 153.5 | 503.1 | 56.9 | 8.8x |
| Yokohama Gyorui Co., Ltd. | 32.9 | – | 0.998 | – |
| Yokohama Maruuo Co., Ltd. | 48.8 | 31.8 | 3.59 | 8.9x |
| Yuasa Funashoku Co., Ltd. | 149.4 | 106 | 24.3 | 4.4x |
Do these multiples apply during this pandemic?
I see owners willing to take a lot less… – Should this not be updated, or some sort of disclaimer applied?