
[Semiconductor valuation multiples have been updated for 2024 – see here.]
Semiconductor companies have become increasingly important in the tech world.
They are the ones responsible for producing the chips that go into almost every electronic device, from phones to computers to cars.
Semiconductor companies are at the forefront of innovation and are constantly pushing the boundaries of what is possible.
And as technology advances and becomes more integrated into our everyday lives, the demand for chips and other semiconductor products is likely to increase, making it a potentially lucrative investment opportunity.
Additionally, many semiconductor companies have strong balance sheets and are well-positioned to benefit from any future technological breakthroughs.
Types of Semiconductor Companies in the Analysis
There are a variety of semiconductor companies, each specializing in different areas of chip production.
Some companies focus on creating basic chips, while others specialize in more complex, specialized chips.
Companies may also specialize in certain types of chips, such as memory chips, processor chips, or graphics chips.
Additionally, some companies specialize in producing chips for specific applications, such as automotive or medical, while others focus on producing chips for more general use.
In this analysis, I didn’t limit the data set to companies in the United States, Canada and the UK, as I typically do in my analyses.
There are 927 companies in the data set before removing some companies that have outlier data in some of the valuation multiple analysis.
I also included all sizes of semiconductor companies.
This includes giant recognizable companies leading the industry such as Taiwan Semiconductor Manufacturing Compnay, NVIDIA, Intel, Qualcomm, AMD.
The data set also includes microcap companies such as Major-Power Technology in Taiwan that has a market cap of less than $15 million as of January 2023.
(Note, because the data set has around 1000 companies, there may be companies that are not true pure play semiconductor companies that are falsely included in this data set and because I cannot go through 1000 companies one by one to remove them from the data set as nobody pays me to do these analyses…)
Semiconductor Industry PE Ratio
The semiconductor industry PE ratio was calculated using 637 companies in the data set.
The average PE ratio for the industry is 22x and the median PE ratio is 15x.
With a large data set such as this one with 600+ companies, the median would be a better estimate of PE ratio to use than the average.
Even though the data set removes outliers, larger multiples pull up the average unfairly.
Semiconductor Industry Average Ratios
The other semiconductor industry average ratios are as follows.
The median revenue multiple for the semiconductor industry is 2.3x. The average price to revenue ratio is 4.4, which is higher than the median.
Again, because the data set is a real world example and is not likely normally distributed, using the median would be more reliable.
The median EBITDA valuation multiple (EV / EBITDA ratio) for the semiconductor industry is 10.4x.
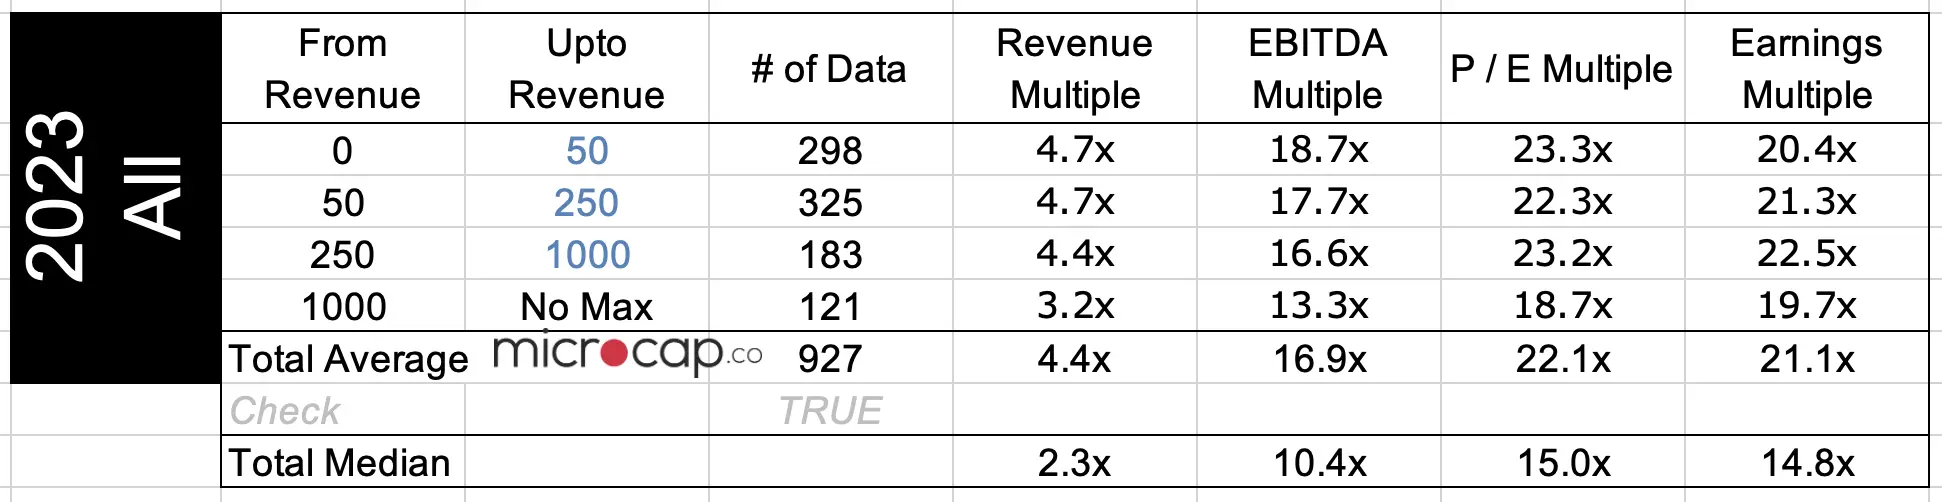
Looking at the semiconductor industry average ratios (not median) based on the size of companies, the revenue multiple, the EBITDA multiple and the PE ratios all decrease as the size of companies increases.
This is an interesting observation and the likely explanation (without evidence) is that there are economies of scale for semiconductor companies.
So, as the companies become larger, they are producing more at lower costs and thus have higher margins. And if there are higher margins, the valuation ratios would be lower.
Another explanation is that the large-cap companies are highly recognizable and popular among investors.
And with their increasing popularity based on their name brand, the valuation of the companies get inflated with higher demand for their stocks.
US Semiconductor Companies Only
Comparing the average industry ratios (not median) between total companies in the world and only US companies, the valuation ratios are in a pretty similar range.
For example, the average revenue multiple for ~900 semiconductor companies in the world is 4.4x vs US only is 5.2x.
The average EBITDA multiple for semiconductor companies in the world is 16.9x vs in the US only is 16.6x.
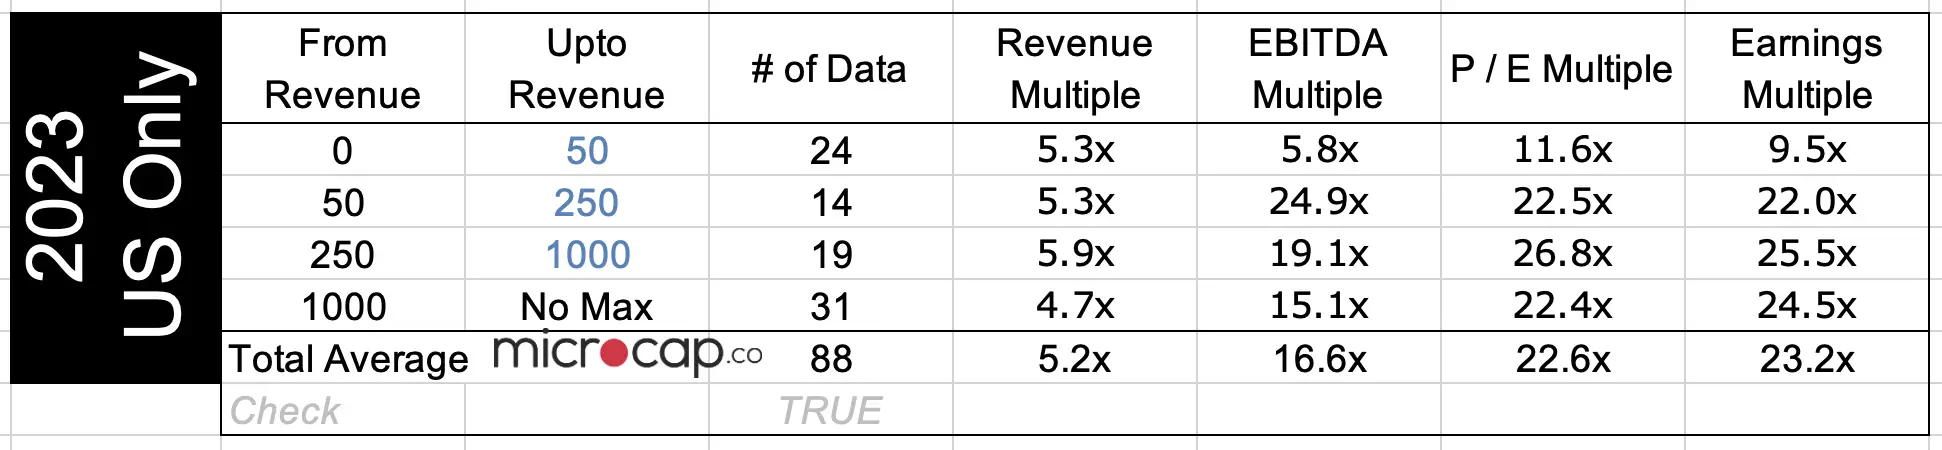
This is another interesting takeaway, because to me, this insinuates that the US does not dominate the semiconductor space in the world.
How To Use Valuation Multiples To Value a Company
Now that you have the valuation multiple, how do you use it to value a company?
For those who are not familiar with using valuation multiples to value companies or those who are but need a refresher, I wrote posts detailing exactly how you can do that.
Hopefully you can use them as helpful guides. Click on the link below to go to the post.
- How to value a company based on revenue
- How to value a company based on EBITDA
- How to value a company based on earnings
- How to find your own valuation multiples
- Other posts on how to value a company
Download Data Set
To download the ~1000 company data set in this analysis, enter your email address below to sign-up for the mailing list and the data set will be sent to your email directly.
(I have never sent an email to the mailing list, but I may in the future, who knows. But the reason for mailing it directly is because if you can download it with a click of a button, the internet bots go nuts.)
Thanks for reading as always and leave a comment if you found it useful!
If you’re interested, read my post on the valuation multiples for manufacturing companies in general and see how they fare in comparison to the semiconductor industry.