
[This is a part of a series on performing financial analysis of a company. If you want to check out all the parts of the series first before continuing, then click here.]
Cash flow statement is a very powerful tool. It is perhaps the part of the financial statements that is most telling about a company’s future performance compared to the balance sheet and the income statement.
At first glance, a cash flow statement is less obvious in showing a snapshot performance of the company. But, once you know the techniques to analyze a cash flow statement, you’ll see that it is very insightful into the company’s financial safety net.
First, we will discuss the anatomy of the cash flow statement. Then, we will hone in on each section of the cash flow statement and discuss what the numbers mean.
We will then introduce techniques to analyze the cash flow statement.
As always, my goal is to show that financial analysis doesn’t have to be a convoluted exercise. We will make each step succinct and only discuss what’s really necessary.
Feel free to jump ahead to whichever section in the table of contents below. I suggest reading from top to bottom though to take it all in in an organized flow.
Table of Contents
-
- Breakdown of a Cash Flow Statement
- How to Analyze a Cash Flow Statement
- 1. Stable Cash Flow from Operating Activities
- 2. Cash Flow from Operating Activities / Sales Ratio
- 3. Positive Cash Flow from Operating Activities (Exceptions)
- 4. Cash Flow from Investing Activities vs Depreciation
- 5. Managing Debt using Cash Flow from Financing Activities
- 6. Too Much CFF & Not Enough CFO
- 7. Free Cash Flow (FCF)
- 8. Ending Cash Available
- Summary
Breakdown of a Cash Flow Statement
The point of the cash flow statement is to isolate the activities of the actual cash that came in and out of the company over a period of time.
This is necessary because an income statement will show you how much you made and spent, but it also includes non-cash activities. As such, a positive profit doesn’t indicate whether the company has enough cash to sustain itself for the next three years. Conversely, a negative profit doesn’t necessarily mean that the company has no cash to go on.
A cash flow statement is broken down into 3 categories and ends with what I believe is the most important line of the financial statements.
The 3 categories are:
- Cash Flows from Operating Activities
- Cash Flows from Investing Activities
- Cash Flows from Financing Activities
Here’s an example cash flow statement from Craft Brew Alliance’s 10K annual report.
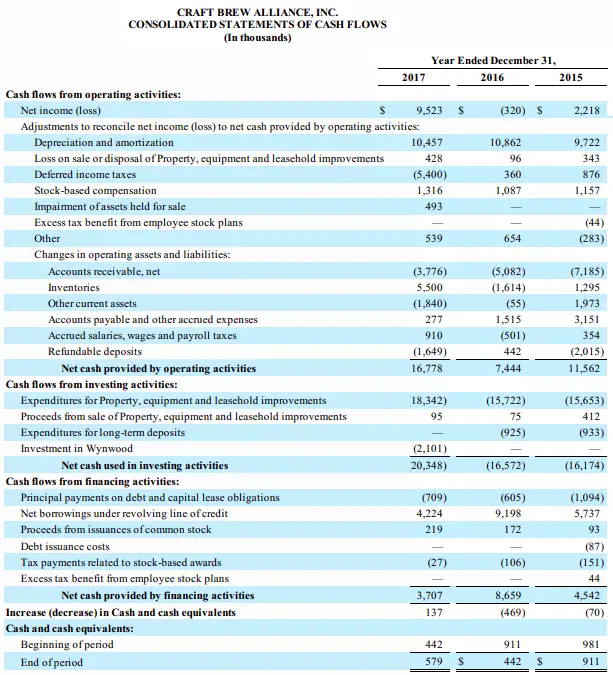
Let’s talk about each category and how the numbers are derived under each category.
Cash Flows from Operating Activities (CFO)
The first category of a cash flow statement shows you how much cash the company’s core operating functions brought in or bled under cash flows from operating activities.
As you can see in the example cash flow statement belonging to Craft Brew Alliance above, CFO starts with net income and ends in net cash provided by operating activities. In 2016, net income was a LOSS of ($320,000). However, the net cash provided by operating activities was $7.4 million.
So, you can see that looking at just the income statement and seeing the negative earnings of ($320,000) could have misled you to think that the company was in dire trouble.
But that’s not the case at all. The company had positive cash brought in of $7.4 million in 2016.
So, what’s causing the discrepancy? Well, all the lines between the ($320,000) and $7.4 million are the answer to that question.
These items are all the non-cash activities that contributed to the net income line in the income statement.
This is the value of understanding and analyzing a cash flow statement. We strip out all the non-cash and non-recurring items and also add in cash items that aren’t reflected in the income statement. That way, we can focus on the company’s core operating performance.
So, we start with net income taken from the income statement.
Next, we add or subtract the non-cash and non-recurring items that are not representative of the typical operating activities, as follows:
- Net income
- Add back: depreciation & amortization
- Add back or subtract: non-recurring items such as a loss or gain on sale or disposal of a business unit or property, plant and equipment
- Add back or subtract: items in the income statement that were non-cash items
- Subtract: changes in current assets (current period’s – last period’s)
- Add: changes in current liabilities (current period’s – last period’s)
The point of the last 2 above (changes in current assets and changes in current liabilities) is that on the balance sheet, changes in the accounts indicate movement of cash. But these items aren’t reflected in the income statement, so we have to account for them.
For example, say accounts receivable at the end of 2016 was $100 and at the end of 2017 was $120. That means the change between the periods is $20. An increase in accounts receivable of $20 means that of the sales that occurred in 2017, $20 of those sales was in credits. But we accounted for that as revenue in the income statement which gets carried down to net income. So, the net income figure inflates the cash received from the sale by $20, because we haven’t received that $20 just yet.
Similar to this example of how a change in accounts receivable illustrates recalibrating the net income figure to reflect only cash movements, we do this to the other current assets and current liabilities items.
So, after making the adjustments above, we get to the last figure, which is the cash from operating activities. If this number is increasing every year, then we know that the operations are performing well.
But if it’s not consistently growing or you see a major spike or dip, then it’s definitely a red flag to delve deeper into what’s going on.
Cash Flows from Investing Activities (CFI)
Cash flows from investing activities represent acquisition and disposal of long-term assets and other business investments other than cash.
This category is perhaps the most straightforward. If you purchase or sold fixed assets, i.e. capital expenditure (capex), then you would include those here. If you acquire a business or divest a business unit, you would also include those here.
We’ll see later what is a reasonable level of capex. But, depending on the type of business, you’ll see two types of capex – initial capex, which is for the new purchase of an asset and a sustaining capex, which is for maintenance of existing assets.
In the example above, we see that Craft Brew spent about $15 million on capex in 2015 and 2016 and spent about $18 million in 2017. This could be because they are expanding their business and need new equipment or it could be because they are replacing an old asset.
Then when we look at depreciation under the cash flow from operating activities, we see that depreciation is about the same at $10.5 million. So, they’re not replacing an old asset. They did spend $3 million more on property, plant or equipment in 2017 compared to previous years.
Cash Flows from Financing Activities (CFF)
The last category of the cash flow statement is cash flows from financing activities. This includes all debt and equity transactions of the company.
If they got new debt funding, this goes here. If they got new equity investors, how much they got from the investors goes here as issuance of stock. The company’s monthly principal payments for debt outstanding goes here. And, if the company purchased stock back from investors and extinguished those shares, this is recorded here as well.
In the example above, Craft Brew’s CFF are as follows:
- Principal payments on debt and capital lease obligations is a cash outflow represented by ($700k) in 2017.
- Net borrowings under revolving line of credit was $4.2 million in 2017.
- Proceeds from issuances of common stock means they got new investors or issued more stock to existing investors. They received $200k in 2017 for issuing new stock. This was most likely for stock options, which we can validate in the Notes section of the financial statement.
- Debt issuance costs is the cost associated with getting new debt funding. Lenders will normally charge between 0.5% to 1.0% for costs associated with the paperwork and time dedicated to closing the debt funding. If the company hired accountants or brokers to administer the transaction, the cost is also shown here. It doesn’t look like the company got new debt funding in 2015 to 2017, so the cost is 0 and marginal in 2015 (which is probably carried over from the previous year).
- Cost related to issuing stock from stock-based awards is shown here. As we see, the tax payment related to stock-based awards was ($27k) in 2017. Any amount that they paid above what they were supposed to is added back in the next line as excess tax benefit from employee stock plans.
And when you sum all that up, the result is net cash from financing activities.
Now, when you put all the above categories of cash flow activities together, you get a powerfully useful number, discussed next.
Beginning and Ending Cash Available
Finally, you add the cash flows from the three sections above (CFO + CFI + CFF) to the beginning period available cash balance to get the ending period available cash balance.
The ending period cash available is a very useful and underrated number.
Cash available is an incredibly important line especially for small businesses because they don’t have the luxury of extra cash cushion.
We see above that Craft Brew’s ending cash balance from 2015 to 2017 was: $911k, $442k, $579k. In the income statement, the annual overhead (Selling, General, and Administrative) expense has been on average $60 million per year, or $5 million per month.
If the company’s assets were hit by some terrible natural disaster wiping out everything they own, they don’t even have one month’s worth of overhead to keep the company afloat.
Obviously, this is an extreme disaster scenario, but cash in the business is too light compared to the size of the business.
Thankfully, the company does have a revolving line of credit with Bank of America so they can drawdown on cash if they are in desperate need.
A big chunk of their cash sits in accounts receivable and inventory as well.
As you can see, looking at the ending cash available over time helps us to decide on our business’s strategic direction because we can forecast the cash available based on historical cash available.
In the next Part of the series, we will forecast the cash flow using an example and an excel analysis.
How to Analyze a Cash Flow Statement – What to Look For
Now that we’ve gone through the anatomy of the cash flow statement, here are some questions to ask yourself to gauge the health of the company.
Every company is different so what to look for in the analysis is different, but generally speaking, these rule of thumb analyses are a very good basis to start for any business.
1. Stable Cash Flow from Operating Activities
Compare the cash flow from operating activities line over a period of time. If in the last few years, this line has been increasing steadily, then the company’s core business is performing well.
Looking at the company’s income statement is not telling of the company’s core business performance. But cash flow from operating activities takes away the fluff.
So, when you strip out gains and expenses from non-core business activities and non-cash activities, you can tell whether the company can fuel its growth internally without relying on borrowed funds or getting outside equity investors.
However, if this line is decreasing or there are major spikes and dips, then it’s worth looking at your core business.
Is your product out of trend? Is your sales force unpredictable? Is your cost of the goods increasing and therefore tightening margins? Is your overhead increasing? Is your productivity decreasing?
2. Cash Flow from Operating Activities / Sales Ratio
In tandem with the previous analysis of a stable cash flow from operating activities, you want to look at the trend of cash flow from operating activities divided by sales (aka revenue).
The ideal scenario is that CFO is increasing steadily and the CFO / sales ratio has also been stable.
If CFO is increasing but CFO / sales ratio is declining, then you ought to look more closely at the cost of goods and general expenses.
There might be something going on here that’s preventing you from converting sales into operating cash flow.
3. Positive Cash Flow from Operating Activities (Exceptions)
You want to aim for a positive CFO.
Sometimes startups and high growth companies will show negative CFO in the beginning, which is okay.
But, as the company grows, CFO should be getting less negative and closer to being positive.
4. Cash Flow from Investing Activities vs Depreciation
While CFO and CFF are indicators of a company’s financial health, CFI is not. But, CFI is still used as an analysis tool.
Is the company maintaining their fixed assets to good standards and replacing them before the assets become obsolete?
If the fixed assets (Property, Plant and Equipment) are winding their useful life down, CFI should not be 0.
If it is 0, then you must determine whether you need to invest in new or maintenance of the fixed assets.
5. Managing Debt using Cash Flow from Financing Activities
A couple of things you want to watch out for here. First, see if the repayment for debt is sticking to the repayment schedule.
And, if there is surplus of cash, then a target repayment schedule should be set in order to pay off the debt faster. Reducing the amount of debt on your balance sheet always helps in creating a cushion of financial safety net.
But, the second thing is you don’t want to repay too fast. You don’t want to be using extra cash flow from operating activities to repay more debt than necessary if that means you’re jeopardizing the growth of your business.
6. Too Much CFF & Not Enough CFO
Leveraging your business is good for equity investors, but it puts your business in a vulnerable position.
If cash flow from financing activities continue to grow, while CFO declines, then your company may be getting ahead of itself.
It’s a good idea at this time to think about scaling back operations so that the business isn’t incurring so much expense that it needs to rely on borrowed funds.
7. Free Cash Flow (FCF)
Free cash flow to the firm means the NET cash that came into the company that’s available to equity investors and the lenders to the company.
Free cash flow is calculated as CFO – capital expenditures (found in CFI).
Just like CFO, you want FCF to be positive and you want it to be trending upward steadily.
8. Ending Cash Available
The last cash flow statement analysis is to manage the ending cash available.
You want ending cash available balance to be at least 3 months of cash needs.
Cash needs includes the mandatory payments the company has to make regardless of whether the company is selling goods.
This includes debt principal and interest repayments, and the portion of overhead that cannot go unpaid.
At the same time, be cognizant of not having too much cash available. If a company has too much cash sitting in the bank, that is a cash drag. This cash could be used in other ways to grow the business or the cash position.
Summary
In this post, we discussed the 3 sections of the cash flow statement.
As part of a company analysis (whether you’re auditing your own company or analyzing another company), you should be analyzing the cash flow statement in conjunction with the balance sheet and income statement.
While every business is different and therefore should be analyzed appropriately for that business, the above methods are useful to measure the performance of any company.
Read on to Part 5: How to Determine the Financial Health of a Company for 7 ways that I use to evaluate a company’s financial health.
I think it is an outstanding and easily practicable analysis.
Thank you, Jahangiri! I’m glad you found the article helpful 🙂